
Using Artemis Comparison Tool (ACT) to browse a XDR Typhoid genome Part 2
In this step you will analyse a representative Salmonella Typhi genome (labelled as BL0006) of the extensively drug resistant (XDR) Typhoid outbreak you have been investigating. The short and long reads generated by Illumina and PacBio RSII machines, respectively, were used to create a hybrid assembly and obtain a fully circularised chromosome and plasmid sequences. The final assembled chromosome consisted of 4,733,003 bases, and the plasmid 84,492 bases.
In this step, we will look at BL0006 and compare it with another Salmonella Typhi reference genome called CT18. You will acquire a basic understanding of ACT functionality and use it to explore the genome structure and gene content of the BL0006 genome.
First, make sure that you have downloaded the following files:
- BL60006.dna
DNA sequence of a representative XDR Salmonella Typhi genome.
- Salmonella_enterica_subsp_enterica_serovar_Typhi_str_BL60006_v1.1.gff
genome annotation of BL60006.
- CT18.gbk.txt
DNA sequence and annotation of a Salmonella typhi reference genome.
- CT18_vs_BL60006_blast.result.txt
result of blasting CT18 against BL60006.
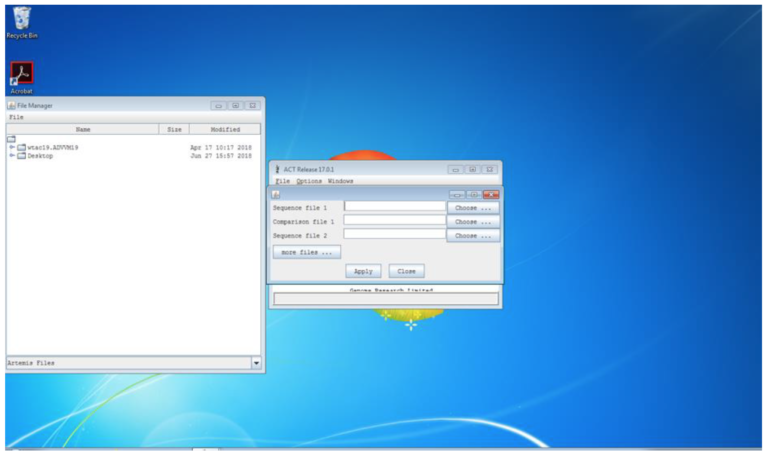
Second, open ACT and click on ‘File’ and ‘Open’. A new box will appear like the one shown below. Choose CT18.gbk.txt as ‘Sequence file 1’, BL6006.dna as ‘Sequence file 2’ and CT18_vs_BL60006 _blast_results.txt as ‘Comparison file 1’. Press the ‘Apply’ button. A series of messages will appear asking if you want to view warnings: click ‘Yes’ and ‘Close’ the Log Viewer.
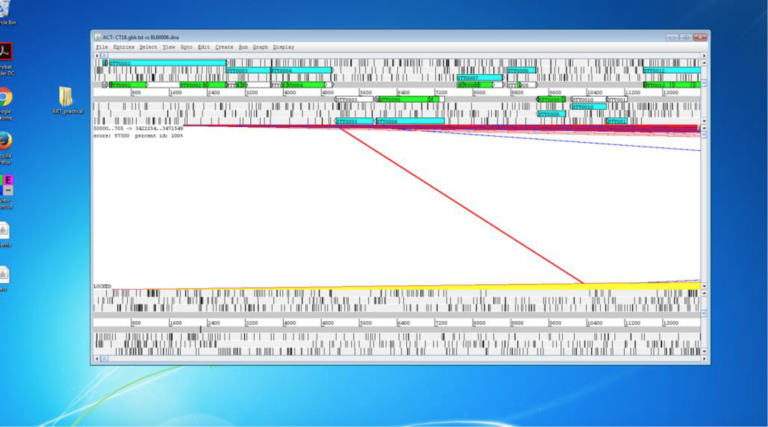
You should now have a view like the one shown below. Annotated “features” such as CDS extracted from the genome annotation file (EMBL, Genbank or GFF) are displayed as coloured boxes, in light blue and green. You will notice that BL6006, the sequence at the bottom, contains no annotation information, unlike the CT18 reference above.
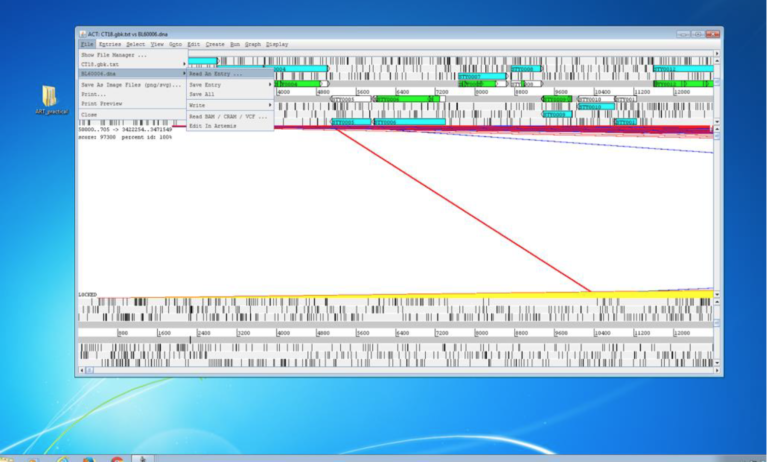
To load the annotation of BL60006, go to the ‘File’ menu, select ‘BL60006.dna’ and click on ‘Read an Entry…’. Use the newly opened ‘Select a file…’ window to browse for the file Salmonella_enterica_subsp_enterica_serovar_Typhi_str_BL60006_v1.1.gff you have previously downloaded. Select this file and click on ‘Open’. A series of messages will appear asking if you want view warnings: click ‘Yes’ and ‘Close’ the Log Viewer.
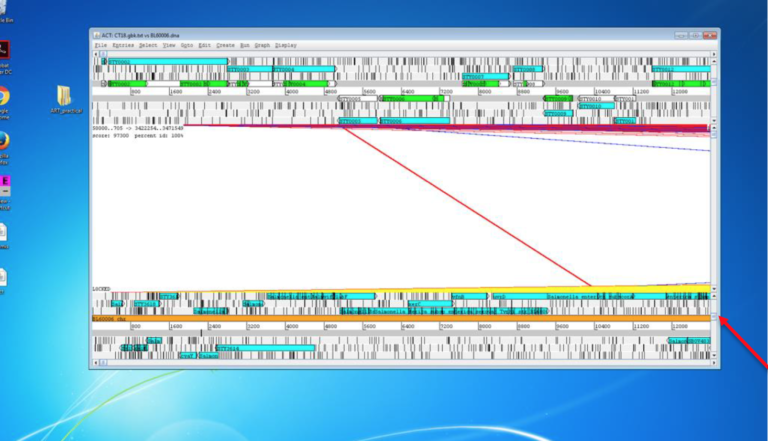
You should have a view like the one below with the annotated feature of the BL6006 genome (the lower genome) now displayed as blue-coloured boxes.
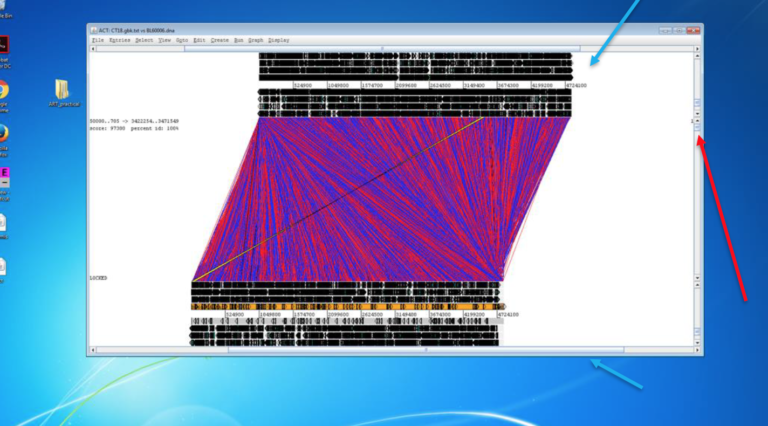
Next, right click anywhere on the comparison area (the part where the red / blue lines appear). On the menu un-tick the option ‘Lock sequences’. Now zoom out using one of the sliders indicated by the arrow below.
Adjust the view using the sliders (pointed by the blue arrow in the figure below) to obtain a view like the one shown below. You will see multiple red and blue blocks in the comparison area indicating BLAST matches. Each coloured block corresponds to a DNA sequence shared by the two genomes being compared.
This is too much detail for our purposes. Therefore, move the middle slider (the one indicated with the red arrow) down to 999 to show shared sequences of at least 999 bp. This way ACT will only show BLAST hits (i.e. shared sequences) longer than 999 bp.
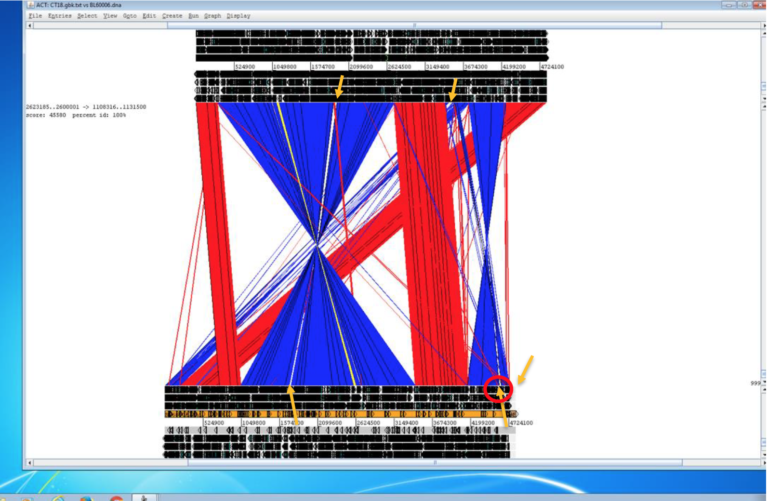
You should now have a view similar to the one shown above. If you look across the genome you can see most parts are conserved – the blue sections indicate that these parts are inverted. This is quite common in bacterial genomes. You can see that there are only a few locations where there are gaps (pointed by orange arrows). These gaps indicate DNA regions unique to that genome, that is, absent in the other genome. As resistance genes are frequently horizontally transferred, we are going to focus our search on these regions. You might have noticed that a very big block of DNA is unique to BL60006 at the right hand (3’-) end of the genome, this is close by another block of unique DNA (in the red circle). We are going to focus our attention on this block of unique DNA. Zoom into the region indicated by the red circle.
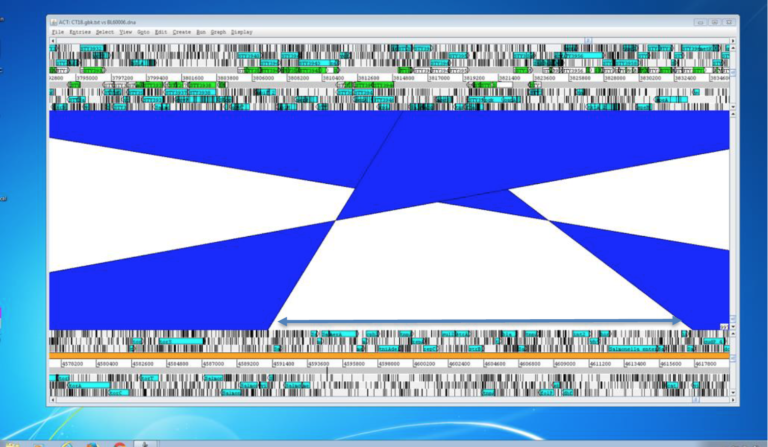
After zooming in, you will have a view like the one shown below. Now click on the brown box at the end of BL60006 sequence (indicated by the red arrow). Under the ‘View’ menu, select ‘BL60006.dna’ and ‘Selection’. In the newly opened ‘Artemis Selection View’ window you will see that this feature is called pBL60006. This DNA region is not part of the bacterial chromosome but a separate plasmid called pBL60006, also included in the file. We will come back to the plasmid later.
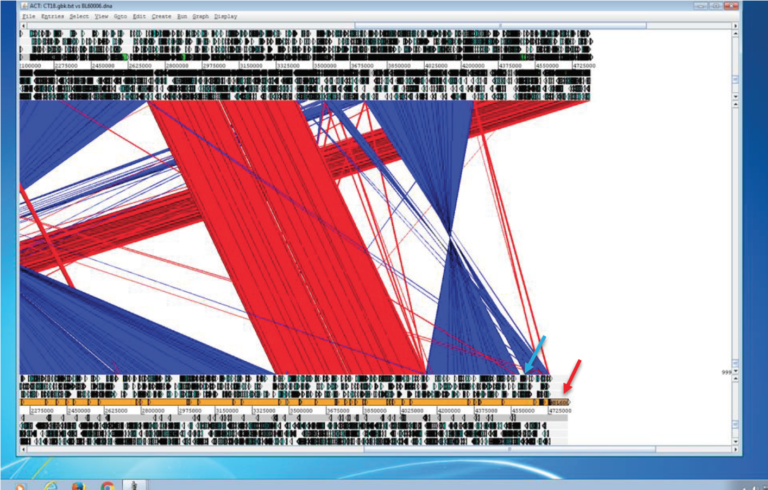
We are now going to look at the block of unique DNA that is just upstream from this (indicated by blue arrow). Zoom into this region and take a closer look at the genes that are present. (The genome location is: 4591121..4557538 – so if you have trouble navigating there use: ‘Goto -> BL6006.dna -> ‘Navigator’ -> ‘Goto Base:’ and type 4591121.
You should now have a view like the one above. Right click on the genes (displayed as light-blue boxes) and select ‘View’ followed by ‘Selection’. Based on the information shown in the ‘Artemis Selection View’, can you find any antibiotic resistance genes? Based on the identified genes, which antibiotics should this strain be resistant to?
To finish this step, we will use Artemis to explore the annotation of the plasmid pBL60006. After launching Artemis, select ‘File’ followed by ‘Open…’ to browser for the file Salmonella_enterica_subsp_enterica_serovar_Typhi_str_BL60006_v1.1.gff. Now navigate to the brown plasmid sequence (at the far-right end of the genome). Zoom in to the region at coordinates 4792793..4806592 (you can use ‘Select’ – > ‘Base Range’ and then input the coordinates to highlight the region of interest). Can you find any resistance genes here? What strikes you about this region in comparison to the chromosomal region investigated before? How do you think this block of DNA got into the plasmid (e.g. can you find any genes associated with mobile genetic elements?)
Remember that Pathogenwatch can automatically do this for you, that is, identify antibiotic resistance genes and predict antibiotic susceptibility.
For more on Artemis, follow this link to one of the WGC ACSC courses: Bacterial Genomes: Accessing and Analysing Microbial Genome Data.
For more on ACT, follow this link to one of the WGC ACSC courses: Bacterial Genomes: Comparative Genomics using ACT
Bacterial Genomes: Antimicrobial Resistance in Bacterial Pathogens

Bacterial Genomes: Antimicrobial Resistance in Bacterial Pathogens
Reach your personal and professional goals
Unlock access to hundreds of expert online courses and degrees from top universities and educators to gain accredited qualifications and professional CV-building certificates.
Join over 18 million learners to launch, switch or build upon your career, all at your own pace, across a wide range of topic areas.


