
Whole-genome view of GC content
In addition to looking at the fine detail of the annotated features it is also possible to look at the characteristics of the DNA covering the region displayed. This can be done by adding various plots to the display, showing different characteristics of the DNA. Some of the plots can be used to look at the protein coding potential of translation frames within the DNA, and others can be used to search for horizontally acquired DNA (such as GC frame plot).
Return to the genomic regions with the gene fbaB and turn on the GC content plot. To make this process faster and clearer, switch off the display of stop codons by clicking with the right mouse button in the main view panel. A menu will appear with an option to de-select ‘Stop Codons’.
You will also need to temporarily remove all of the annotated features (de-select feature arrows, feature labels and feature borders) from the Artemis display window. In fact if you leave them on, which you can, they would be too small to see when you zoomed out to display the entire genome.
Alternatively, you can hide the annotation de-selecting the S_typhi.tab entry on the top left corner of the Artemis window. The activated annotation will be highlighted in yellow and will become grey (and de-selected) once you remove the click from the label. You will notice the that annotation in the genome is hidden.
One final tip is to adjust the scaling for each graph displayed before zooming out. This increases the maximum window size over which a single point for each plot is calculated. To adjust the scaling click with the right mouse button over a particular graph window. A menu will appear with an option ‘Set the Window size’, set the window size to ‘20000’. Sometimes this values exceeds the maximum set by default. You can change the maximum value using the ‘Set Min/Max values’ from the same menu.
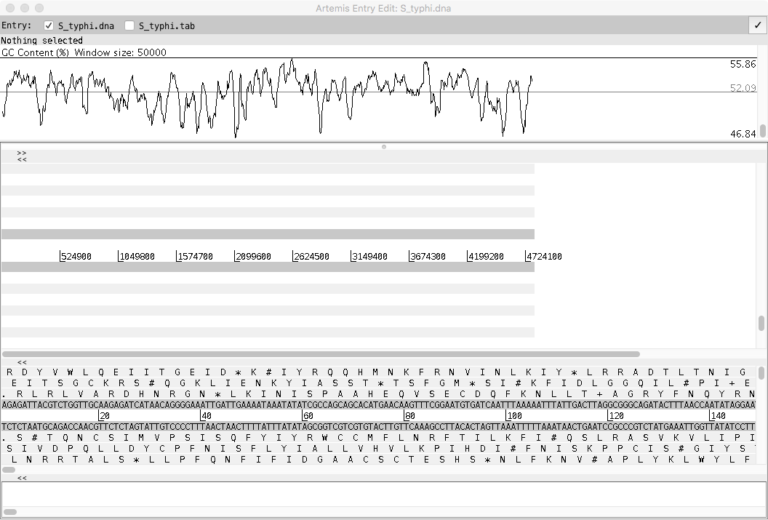
You are now ready to zoom out by dragging or clicking the slider. Once you have zoomed out fully to see the entire genome, you will need to adjust the smoothing of the graphs using the vertical graph sliders as before, to have a similar view to that shown above.
Bacterial Genomes II: Accessing and Analysing Microbial Genome Data Using Artemis


Bacterial Genomes II: Accessing and Analysing Microbial Genome Data Using Artemis
Reach your personal and professional goals
Unlock access to hundreds of expert online courses and degrees from top universities and educators to gain accredited qualifications and professional CV-building certificates.
Join over 18 million learners to launch, switch or build upon your career, all at your own pace, across a wide range of topic areas.


