
Week 5 round up
In Week 5, you had a chance to catch up, but also worked with us to crowdsource some new data. A big thanks to everyone who took part!
By playing the game, you generated data on how scenic photographs taken in different parts of London were. By Friday, the 23rd of June, we had 10,394 votes on 6,948 images.
Here is a map of how the votes are starting to give us an understanding of where the more scenic places in London might be:
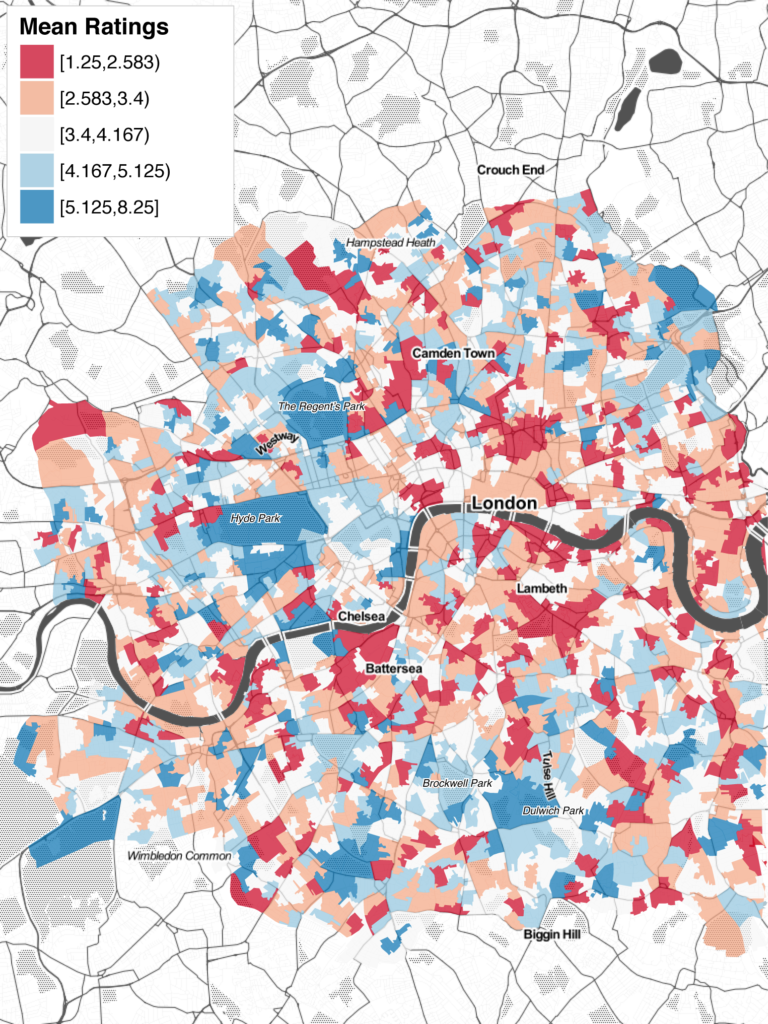
In the map above, we’ve aggregated the votes by “LSOA”. An LSOA is a relatively small geographic area which is commonly used in the UK, for example when working with Census statistics. You can also view an interactive map which depicts the scores for individual images here.
You’ll be able to see some patterns have started to emerge! For example, images in parks, such as Hyde Park and Regent’s Park, have generally been rated as more scenic. The highest rated images also seem to often be abundant in nature.
However, to see clearer patterns we need more votes per image. This helps to build a consensus on the scenicness of an image, rather than it being overly driven by a single individual’s perception of how scenic an image might be.
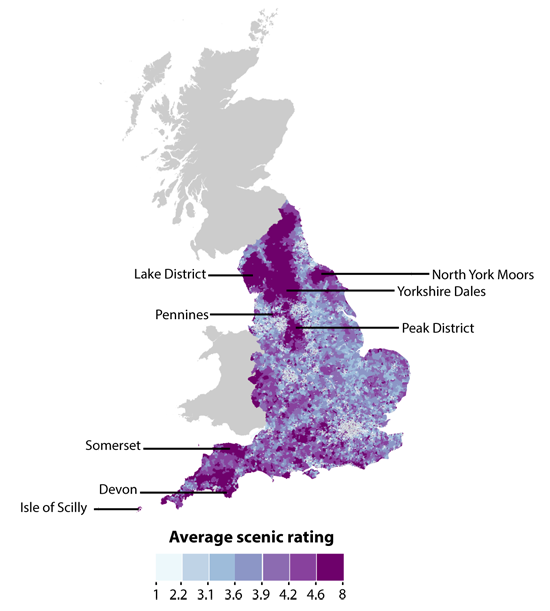
For example, for our paper “Quantifying the Impact of Scenic Environments on Health” we used 929,125 ratings of over 129,056 images to create the map below. Only images that had been rated 3 or more times were included in this analysis. You can see that places in which people like to go hiking such as the the Lake District are clearly rated as more scenic, while cities in general are less scenic.
We will continue to gather more votes for the images, and once we’ve collected more votes per image, we will carry out a careful analysis of this dataset. We’ll keep you up to date with our findings!
We hope you enjoyed this exercise, and that you now have a greater understanding of how crowdsourcing with online games can help us measure aspects of the world that may not have otherwise been very easy to measure. Thank you all once again for taking part!
Big Data: Measuring And Predicting Human Behaviour


Big Data: Measuring And Predicting Human Behaviour
Reach your personal and professional goals
Unlock access to hundreds of expert online courses and degrees from top universities and educators to gain accredited qualifications and professional CV-building certificates.
Join over 18 million learners to launch, switch or build upon your career, all at your own pace, across a wide range of topic areas.


