Skip main navigation

Introduction to depressions

Introduction to depressions
Introduction To Depressions
© University of Reading and Royal Meteorological Society

Mid-latitude depressions, extra-tropical storms, cyclones (at mid-latitudes) or low pressure systems are all different names for the same thing. They all refer to the storms which bring the UK most of its weather, particularly in the autumn and winter. But what are they, how do they form in mid-latitudes, and why do they cause weather?

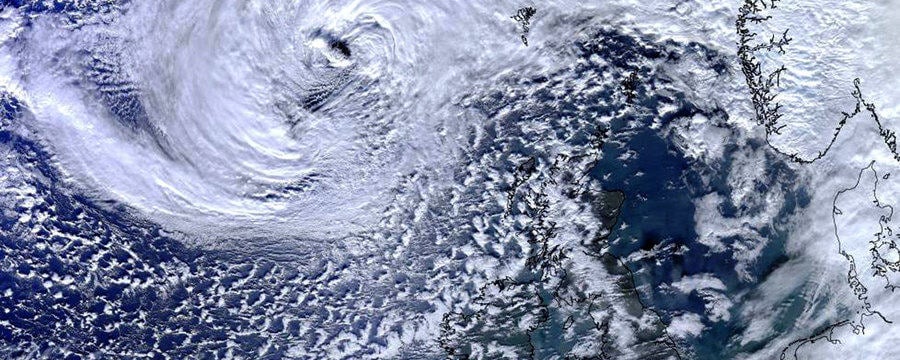
These storms typically last several days, are a few hundred kilometres in size and travel approximately eastwards across the North Atlantic. They are characterised by a swathe of cloud the same scale as the UK, and when shown on a weather map (also known as a synoptic chart), are distinguished by low pressure in the middle and distinctive fronts. They bring us both our ‘normal’ and our ‘extreme’ weather.

Before we explore how these storms are formed, let’s start with a bit of history. The first scientific study and classification of these weather systems was performed by a group of Norwegian meteorologists: the Bergen School. The location was no coincidence, Bergen experiences a lot of weather systems.
Working without the benefit of satellite and radar pictures, the tools we use to tell us about the atmosphere today, this group did a remarkable job of describing the nature of weather systems. Using only ground based observations and information from weather balloons, they realised that depressions occur as a consequence of the pole-to-equator temperature gradient.

The pole-to-equator temperature gradient

As we live on a spherical planet, you can see in Figure 2, somewhere on the Earth’s surface will always be at right angles to the Sun’s rays, such that the Sun’s light is fairly concentrated (a). In contrast, in other areas on the Earth’s surface which slope away from the Sun’s light, the Sun’s light will be more spread out (b). As the Earth’s surface is warmed by the Sun, the more concentrated light falling on (a) will warm the surface more than in area (b). This is why the Tropics are always warmer than the poles.
You can see this in further detail in Figure 3. In this graph, the latitude is recorded along the bottom (the x axis) and the amount of energy is recorded on the left (the y axis). The blue line shows that, over the course of the year, the Tropics receive more energy than the North Pole and South Pole. The red line shows the amount of energy the Earth is losing to space.
As you can see, the Tropics lose more energy than the Polar regions, but the two lines are not the same. The Tropics are absorbing more energy than they are losing, whilst the North and South Poles are losing more energy than they are absorbing. If energy absorption and loss are the only factors at play this would mean that the Tropics would be always warming, and the Polar regions always cooling. However this isn’t the case, something else must be transporting heat from the Tropics to the poles.
This is where storms, such as mid-latitude depressions (and hurricanes in the Tropics) come in to play.
Figure 3: A graph showing how the amount of energy the Earth receives from the Sun (blue line) and the amount of energy the Earth loses to space (red line) varies with latitude. If the blue line is above the red line, the Earth is getting more energy than it is losing at that latitude. If the red line is higher, the Earth is losing more energy than it is getting.
The map of the world in Figure 4, shows changes in temperature from the Polar regions to the Tropics, using different colour bands. The temperature cools most rapidly where the colour bands on the map are narrowest, in the mid-latitudes. As you can see, the rate at which the Earth’s temperature falls, is not steady as you travel from the Tropics to the Polar regions.
Figure 4: A map of average December temperature of the atmosphere about 1.5km above the ground. © NOAA-ESRL Physical Sciences Division, Boulder Colorado. Data source NCEP/NCAR Reanalysis 1: Summary

The Bergen meteorologists realised this temperature gradient was a key part of the formation of weather systems. They saw the mid-latitudes as being where the warm, tropical air met and ‘fought’ the cold, Polar air. They were working at a time when fronts were very much part of people’s vocabulary, they referred to the temperature gradient as ‘the Polar front’; a boundary separating competing warm tropical air from colder air near the pole.

We’ll discover in the next article why depressions form on this polar front.

© University of Reading and Royal Meteorological Society
This article is from the free online

Come Rain or Shine: Understanding the Weather

Created by
FutureLearn - Learning For Life

Reach your personal and professional goals

Unlock access to hundreds of expert online courses and degrees from top universities and educators to gain accredited qualifications and professional CV-building certificates.

Join over 18 million learners to launch, switch or build upon your career, all at your own pace, across a wide range of topic areas.

Start Learning now