
COVID-19 Progression in Different Countries
In this article, we’ll look at those case timelines and overlay a selection of reported events that had—or potentially had—important impacts on the course of the outbreaks. By the end of this step, you will have gained an understanding of how different kinds of events, including planned and unplanned activities at different scales, are associated with changes in the course of the disease in different countries. Use this to reflect on what you have observed in your local situation or area of interest in the next step.
Let’s look at the early disease events in China, Iran, and India.
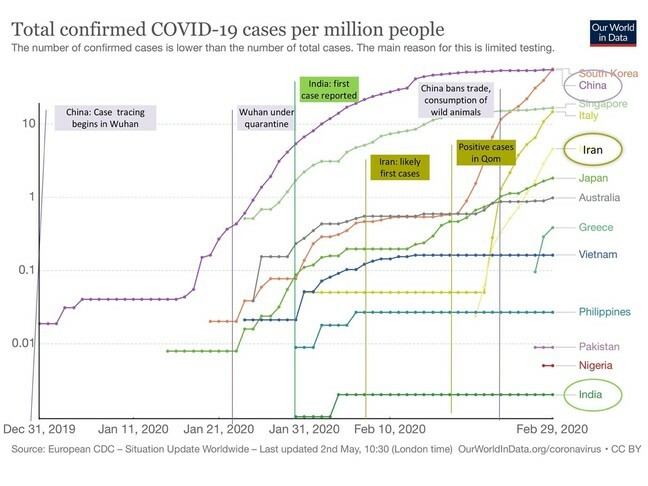 Total confirmed COVID-19 cases per capita and selected timepoint events for different countries January–February 2020. See animation here. (Source: OurWorldInData.org1)
Cases of atypical pneumonia in China have now been identified retrospectively to have occurred nearly one month before the first cases shown on this timeline, which were based on official reports. Contact tracing started in Wuhan city on December 30, 20192. Already, this example shows the need for considering potential outbreak data from different sources. In those early reports, apparent early decreases in cases were due to under-reporting and/or delayed identification of true cases because widespread, standardised testing had not yet been implemented since COVID-19 was such a new disease, reflecting some of the issues we identified in the previous step. Cases with no direct links to Huanan Seafood Market, the location where we currently suspect humans were infected with SARS-CoV-2 from animals, were already increasing by late December2.
The implications for missing early cases are demonstrated in the progress of COVID-19 in Iran. On the timeline above, the first official report ‘dot’ for Iran, which was actually reported deaths due to COVID-19, was February 19. However, it is very likely the disease was present in the holy city of Qom many weeks earlier3. Extensive movements continued in and out of the city until March, and infections in nearly a dozen other countries have been linked back to the early Iranian outbreak. Don’t forget to look at the scale of the graph. Iran’s case reports started on the chart at about 1 case per million. In absolute terms, this is more than 80 cases: something was happening for several weeks already for that number of cases to be detected and reported in later February.
Let’s move on to the middle phase of the pandemic to date in the next animation, which you can navigate to using the link in the image caption.
Total confirmed COVID-19 cases per capita and selected timepoint events for different countries March–April 2020. See animation here. (Source: OurWorldInData.org1)
By the first week in March, cases had increased 30-fold in Iran and public gatherings were curtailed soon after although mosques in Qom, which receive visits from thousands of worshippers from around the world, were not closed until March 15 as the curve of total confirmed cases starts to flatten.
Now let’s look at India. During the early, steep part of the cases curve, there were increasing restrictions on public gatherings, such as the closure of schools. The now-infamous nationwide lockdown was announced on March 24; the growth in cases appears to become less steep around that time.
In Indonesia, cases were detected in early March but a health emergency declaration and the start of social distancing did not occur until the end of that month—note how the total case numbers grow in that time. Another important feature to note is that at that time, the positive rate in Indonesia was 25-40%, as shown in the figure below. Remember, we discussed earlier this week that this suggests insufficient testing was occurring to precisely estimate the incidence of COVID-19 cases. However, the rate of growth in cases did not increase as the Holy Month of Ramadan neared, with domestic travel banned in late April.
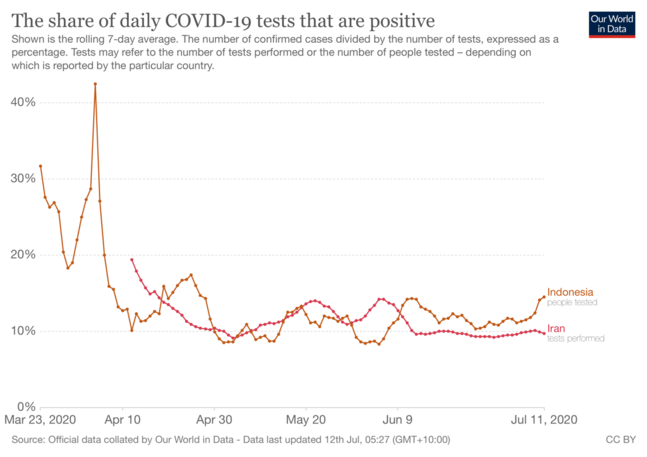 Positive rate for COVID-19 tests conducted in Indonesia and Iran January–July 2020. (Source: OurWorldInData.org1)
In South Africa, a state of disaster was declared in mid-March, soon after cases started rising. At this time, the positive test rate in South Africa was 2-3%4, suggesting that testing rates were satisfactory and allowing the government to respond to the rising case numbers with confidence. Lockdown started on March 23 and the steepness of the cumulative case curve eased, although it has remained largely unchanged since.
The events we have described are just a small number from the early months of the pandemic, when governments were rushing to deal with multiple issues, such as how to obtain and deploy tests as well as, understand the routes and intensity of cases arriving and spreading through their countries. Take some time to review these examples by replaying the animations, which are accessible via the links in the image captions. In the next step, it is over to you to start thinking about your local situation or locations of specific interest.
Note: Graphs covered in Roser et al. ‘The share of daily COVID-19 tests that are positive’ in reference list below.


Reach your personal and professional goals
Unlock access to hundreds of expert online courses and degrees from top universities and educators to gain accredited qualifications and professional CV-building certificates.
Join over 18 million learners to launch, switch or build upon your career, all at your own pace, across a wide range of topic areas.


