Skip main navigation

Measuring Floods and Tsunamis

In this video, Dr Claire Earlie compares tsunamis and floods with their extreme equivalents. In order to make a comparison between floods/tsunamis and their extreme equivalents we need some kind of measure for both.

In this video, Dr Claire Earlie compares tsunamis and floods with their extreme equivalents.

In order to make a comparison between floods/tsunamis and their extreme equivalents we need some kind of measure for both.

Measuring Floods

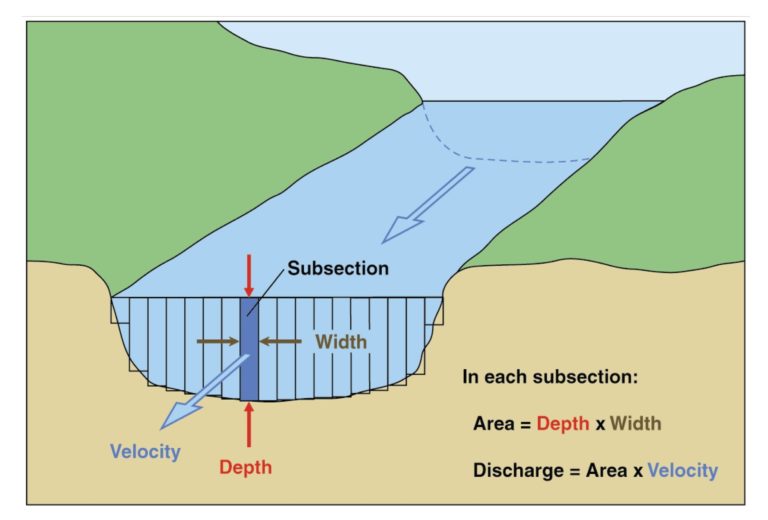
Measuring the volume of water (discharge) that flows by per second is a good way of judging the size of floods. This measure allows us to determine the depth of flowing water, the area the water covers and the power or velocity of the flowing water.

Cross section of flowing water showing how depth, width and velocity are measured. The flowing water is split into subsections. In each subsection the Area is equal to the Depth x Width then the discharge is equal to Area x Velocity. Diagram of Cross Section by USGS, Public Domain

Megafloods

In the video we compared the 2010 Pakistan floods and a megaflood caused when the Eyjafjallajökull volcano erupted in Iceland. Maybe you were surprised to find out that the Pakistan floods were actually larger than the Icelandic megaflood?

Using the measure we’ve outlined above we can add another megaflood we’ve looked at to broaden the comparison.

Event Discharge
2010 Eyjafjallajökull, Iceland megaflood 3,000 cubic metres per second
2010 Pakistan floods 47,500 cubic metres per second
Dover straits megaflood 1,000,000 cubic metres per second

As you can see the Dover straits megaflood vastly outstrips the Pakistan floods and highlights how, when we look at these events over geological timescales, we’ll see how megafloods are truly extreme events.

Measuring Tsunamis

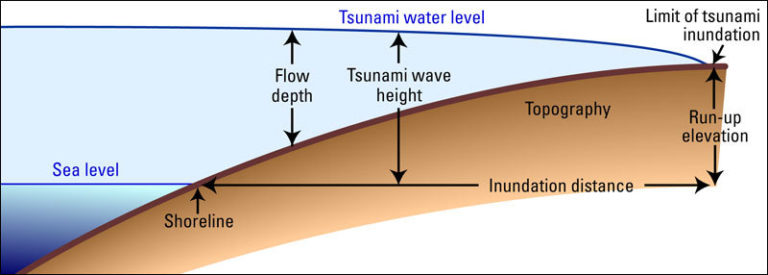
Tsunamis are typically measured by the size of the wave. In the diagram below we can see how the tsunami wave height is measured by reference to the sea level around it. The height of the tsunami results in a greater amount of water being carried to the shore, this is represented by flow depth in the diagram

Diagram showing a tsunami that has reached the shore with a range of measures identified, that include the sea level and shoreline, the flow depth, tsunami wave height, tsunami water level, inundation distance, topography, run-up elevation and limit of tsunami inundation Diagram illustrating some terms used for tsunami measurements by USGS, Public Domain

Megatsunamis

In the video, we also saw how a regular tsunami was larger than a megatsunami. However, just like floods let’s use the measure we’ve described above and add some other events that we looked at earlier.

Event Wave height
1903 Upper Arrow Lake, Canada megatsunami 3 metres
2011 Tohoku, Japan tsunami 7 metres
Storegga Slide megatsunami 30 metres
Chicxulub impact megatsunami 100 metres

This provides a stark example of just how extreme megatsunamis and megafloods are when viewed over geological timescales.

These events have had a significant impact on our planet and help us to understand Earth’s history.

This article is from the free online

Extreme Geological Events

Created by
FutureLearn - Learning For Life

Reach your personal and professional goals

Unlock access to hundreds of expert online courses and degrees from top universities and educators to gain accredited qualifications and professional CV-building certificates.

Join over 18 million learners to launch, switch or build upon your career, all at your own pace, across a wide range of topic areas.

Start Learning now