Skip main navigation

Tsunamis as a secondary hazard: Krakatoa 1883

Read about the 1883 eruption of Krakatau, Indonesia and secondary hazards in the context of a new extreme event.
© Cardiff University

Let’s think about primary and secondary hazards in the context of a new extreme event, the 1883 eruption of Krakatau (or Krakatoa volcano in Indonesia).

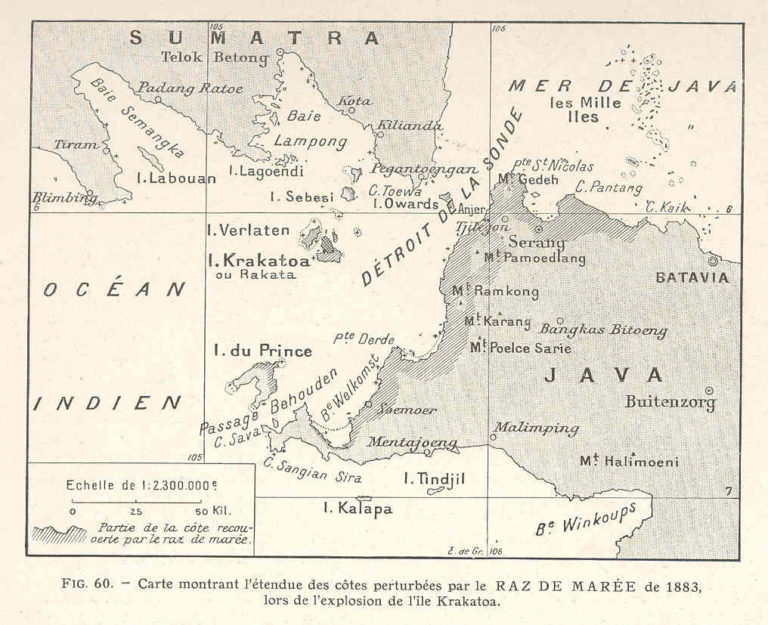
Krakatau is a volcanic island located in the Sundra Strait that separates the Indonesian islands of Java and Sumatra.

A map from 1883 of Krakatoa island showing its location inbetween the islands of Java and Sumatra 1883 Map of Krakatoa, Georges Clerc-Rampal, Public Domain

It was the stage of an extremely violent volcanic eruption in 1883 that blew away a big part of the island.

The eruption started on 20 May 1883 and intermittent activity went on for 3 months until the climactic phase occurred on the 26 & 27th of August.

On the morning of the 27th, four truly enormous explosions occurred. Following this, around two thirds of the island was simply gone, it had been blasted away by the force of the explosions.

The resulting megatsunami

Each explosion triggered a megatsunami. One of these was much larger than the others, and created a wave that spread around most of the world.

This explosion also produced a very fast air blast shockwave that spread around the Earth’s atmosphere. Incredibly this was heard as a sound thousands of kilometers away, and people thought there were hearing cannon fire or a gunshot.

The “sound” from the blast is estimated to have been around 310 dB (for comparison, 150 dB is enough to burst an eardrum, and around 200 dB enough to instantly kill).

The megatsunamis are believed to have been the most deadly aspect of the eruption, causing the majority of the 36,417 recorded deaths.

The coasts of Java and Sumatra neighbouring Krakatoa island bore the brunt of the damage, where casualties were severe.

This means we have few direct observations of the actual eruption sequence, much of what we know has been reconstructed from its effects.

Gathering the evidence

The reason we know all this is because British scientists of the Royal Society were able to compile huge amounts of data about the eruption. You can download this amazing report if you want to browse it.

One of the scientists, Captain W. J. L. Wharton, compiled all the reports he could find from around the world on when the waves related to the megatsunami arrived following the first explosion and how big they were. This means we have an unusually detailed record of the megatsunami.

The speed of the wave was on average just over 300 miles/hr (about 500 km/hr). This is incredibly fast, about half the speed of an airliner, and significantly faster than the fastest Formula 1 cars going at top speed.

The people living on Java and Sumatra close to the island would have had almost no time to get out of the way, even if they survived the eruption itself.

At the time, Capt. Wharton attempted to use this speed to work out the average depths of the oceans that the megatsunami travelled across. He did this based on the known relationship between wave speed, water depth, and the force of gravity.

These estimates were some of the best available, and although in Wharton’s time the correct equations for wave travel in deep water were not known, they are still relatively close to what we now know are the correct answers (an average depth of just under 4 km).

He calculated which of the four blasts could have produced the largest tsunami. The largest wave seems to have initiated at around 10-11 am, which rules out the first two explosions as the source.

It’s much tougher to distinguish between the final two explosions. The third explosion seems to have represented the explosion that destroyed of most of the north part of the island, which probably makes it the best candidate.

However, the fourth explosion seems to have been triggered by a huge landslide from the north side of the remaining part of the island. Given we’ve already seen the importance of huge landslides in generating other megatsunamis, this can’t be completely ruled out.

Finally, Wharton was able to identify a large number of waves all around the world. Many of these were recorded in places like Europe, New Zealand, and around the Atlantic, where other continents block the direct paths of the waves.

At the time, the Royal Society scientists were able to convince themselves that these could not be the same waves produced by the third explosion. They based this on the impossibility of the travel paths, and in particular, on the very large water depths that these waves seemed to predict. However, they couldn’t work out what could have caused them.

Today we believe that these apparently very fast waves must have been due to the very fast spreading of the shockwave through the atmosphere rushing over the ocean surface and creating new waves at a great distance away. This is much like how the wind over the oceans creates “normal” waves today.

This was a truly remarkable, extreme event and another story of how careful investigation and gathering of evidence led to a detailed understanding of an event that happened over a hundred years ago.

It highlights the relationship between the hazards associated with the events we’ve been looking at in this course.

© Cardiff University
This article is from the free online

Extreme Geological Events

Created by
FutureLearn - Learning For Life

Reach your personal and professional goals

Unlock access to hundreds of expert online courses and degrees from top universities and educators to gain accredited qualifications and professional CV-building certificates.

Join over 18 million learners to launch, switch or build upon your career, all at your own pace, across a wide range of topic areas.

Start Learning now