
Infrared spectroscopy: an overview

Infrared spectroscopy of food samples is generally carried out using one of two wavelength ranges: the near-infrared (NIR) or the mid-infrared (MIR).
 The visible and infrared parts of the electromagnetic spectrum, showing the usual definitions of the near-infrared and mid-infrared wavelength (or frequency) ranges. Also shown are the relationships between wavelength, frequency and wavenumbers
In some NIR experiments, it is useful and easy to collect data from the red part of the visible wavelength range too, in which case the spectroscopy may be referred to as Vis-NIR. It is usual to describe near-infrared (and visible) radiation by its wavelength measured in nanometres (nm, 10-9m) or microns (μm, 10-6m).
In contrast, mid-infrared radiation is generally described by its frequency. However, rather than using Hertz as the unit of frequency, mid-infrared spectroscopists have historically expressed frequency in terms of wavenumbers (with units cm-1, which indicates wave cycles per centimetre) for reasons of convenience. Frequency measured in Hertz is converted into wavenumbers through division by a constant value – the speed of light.
An infrared spectrum is a graph that shows the detected intensity of infrared radiation on the vertical axis, plotted against the wavelength (or frequency) along the horizontal axis. It generally contains a number of features – absorption bands – which arise from the interaction of the radiation with vibrating molecular bonds.
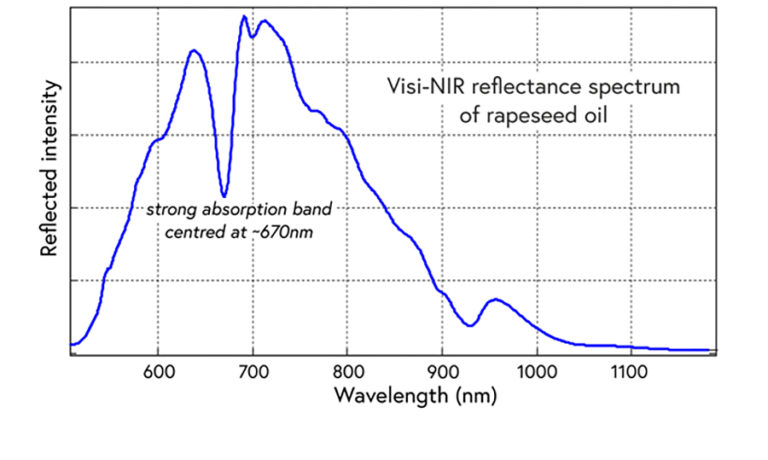 This is a typical visible/near-infrared reflectance spectrum of an edible oil. The strongest feature is an absorption band at around 670nm (approximately the boundary of the visible and NIR regions).
Absorption bands are bell-curved (Gaussian) in shape: centred at specific frequencies, but relatively wide. Depending on the experimental setup, they can appear as downwards troughs (transmission spectra, reflectance spectra) or upwards peaks (absorption spectra).
Most infrared spectra contain multiple, overlapped absorption bands. The overall pattern of bands is determined by the nature of the different chemical entities in the sample (carbon-hydrogen bonds, carbon-oxygen bonds, and so on) and of the different modes of bond vibration (stretching, bending, rocking).
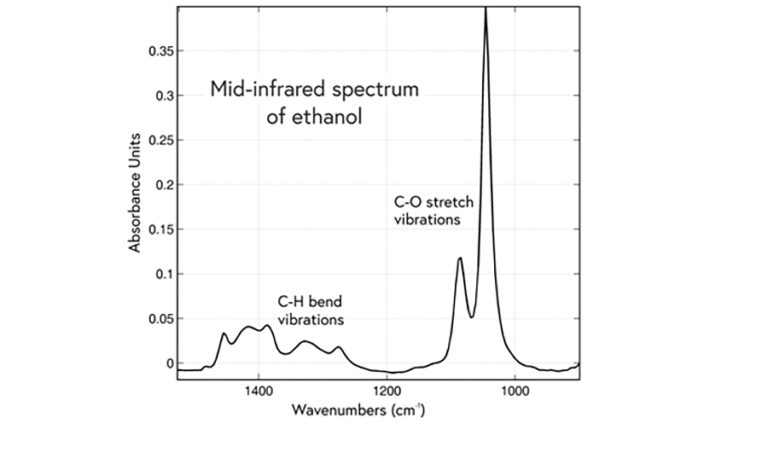 A typical mid-infrared spectrum, of ethanol, showing the “fingerprint” region where the strongest absorption bands occur. Note that a convention in the mid-infrared is for the x-axis scale to be reversed, i.e. with values decreasing from left to right.


Reach your personal and professional goals
Unlock access to hundreds of expert online courses and degrees from top universities and educators to gain accredited qualifications and professional CV-building certificates.
Join over 18 million learners to launch, switch or build upon your career, all at your own pace, across a wide range of topic areas.


