Skip main navigation

Infrared spectrometers: NIR and MIR compared

Near-infrared and mid-infrared spectrometers each have advantages and disadvantages. This article compares the two approaches.
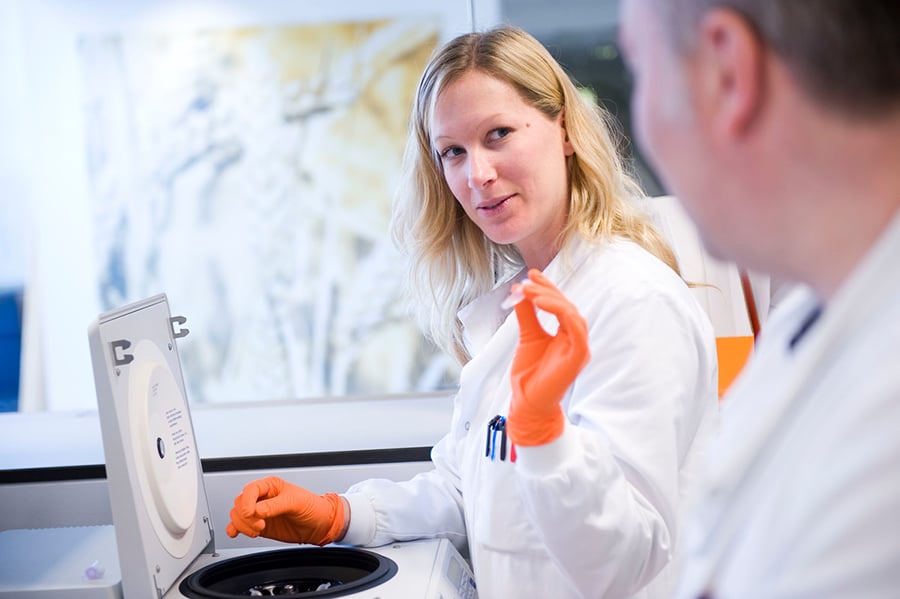
Researchers using a spectrometer
© University of East Anglia

Infrared spectrometers

Infrared spectrometers can broadly be divided into two types: dispersive and Fourier transform instruments. Although it is possible to configure each type of instrument to work across both ranges, in general, dispersive spectrometers operate in the NIR, and Fourier transform instruments in the MIR.

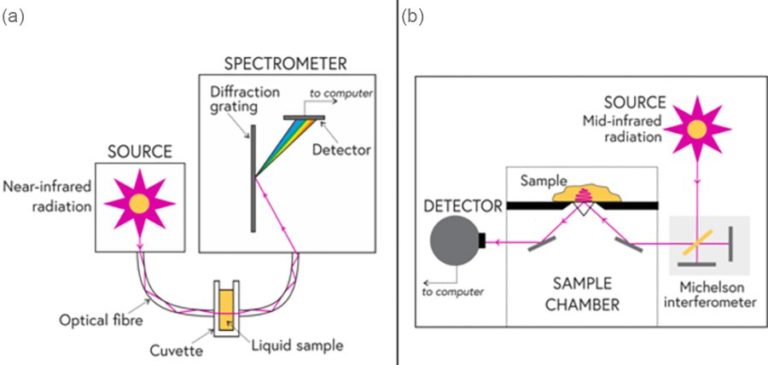
Schematics of NIR and MIR spectroscopy (a) A system for carrying out NIR spectroscopy. An experimental setup for carrying out near-infrared spectroscopy, here using a transmission cell for liquid samples; (b) Inside an FITR spectrometer. A schematic of a Fourier transform infrared (FTIR) spectrometer for carrying out mid-infrared spectroscopy. The sampling method here is called attenuated total reflectance and can be used for examining liquid and solid samples.

The key component of a dispersive spectrometer is the diffraction grating, which splits the broadband NIR radiation from the source into constituent wavelengths before it is detected and passed electronically to a computer.

In an FTIR spectrometer, a device called a Michelson interferometer produces a time-varying, frequency-dependent encoding of the broadband MIR radiation. The detected signal is decoded by the computer, using a mathematical process called Fourier transformation, to produce a spectrum.

Near-infrared and mid-infrared compared

During the early development of infrared spectroscopy for food analysis, the focus was on the use of near-infrared. NIR spectroscopy is now firmly established in the food sector, utilised for a wide range of applications. However, as MIR instrumentation has developed, becoming simpler to use and more accessible in terms of cost, applications to food analysis are increasingly being reported. Here, the advantages and disadvantages of each technique in the context of food analysis are compared.

Dispersive NIR spectroscopy Fourier transform MIR spectroscopy (FTIR)
Advantages:
Cheaper instrumentation costs than MIR

Much more robust components – easier to make rugged instruments, involving no moving parts

Very flexible sampling arrangements – interaction between radiation and sample can take place via reflection or transmission, from a wide range of sample types and geometries

Fundamental vibrations of molecular bonds occur in the “fingerprint” region of the MIR, making the spectral profiles very sensitive to chemical composition – even very similar molecules can produce quite distinctive spectra

Very accurate frequency scale due to internal laser reference beam – facilitates co-addition of data to improve signal-to-noise ratio.

High optical throughput – plenty of radiation available to interact with sample

Detector receives all wavelengths at once giving a signal-to-noise benefit ((i.e. multiplexing)

Disadvantages:
Significant absorption bands only arise from bonds that include a hydrogen atom. This means that functional groups such as C=O (carbonyl, found in oils and fats) and C-N (found in proteins) do not produce distinct, identifiable bands

Absorption bands are very broad and overlapped, so that many chemically different samples give rise to almost indistinguishable spectral profiles, and assignment of features to individual chemical entities is difficult

Some absorption bands are so strong in the infrared (O-H in water, for instance) that sample thicknesses of more than a few microns lead to complete absorption and no spectrum is obtained. This makes transmission sampling practically impossible for many samples, and reflectance methods must be used instead.

Attenuated total reflectance (ATR), which has an effective sample pathlength of <10microns, is the best way to analyse food samples, but a disadvantage is that very little of the total sample volume is actually inspected – this can be problematic for samples that are not homogenous on the micron scale

© University of East Anglia
This article is from the free online

Identifying Food Fraud

Created by
FutureLearn - Learning For Life

Reach your personal and professional goals

Unlock access to hundreds of expert online courses and degrees from top universities and educators to gain accredited qualifications and professional CV-building certificates.

Join over 18 million learners to launch, switch or build upon your career, all at your own pace, across a wide range of topic areas.

Start Learning now