
Further issues and examples
You might have worked hard to estimate the water footprint associated with the fruit and vegetables in your shopping basket.
Two almost identical baskets of products might have very similar water footprints in terms of gallons or mega-litres of water used. However, we have to ask where was the water resource used.
A volume-based water footprint will not necessarily reveal the effect of water use in specific places where food items were produced. For example fruit production with a lower water footprint might be more harmful to the environment than fruit with a higher water footprint, if the former is grown in a region where water resources are under real pressure.
Due to this problem (see later) some research attempts to factor in a water stress index to weight a water footprint based on local environmental conditions.
The preceding material covering definitions and measurement reveals that in practice the nature of a water footprint for a household or region or nation is virtually impossible to estimate accurately.
Material in academia and from consultancies that provides point estimates of water footprints can be entirely misleading. The data we have available on water usage is simply never good enough to gain point estimates of footprints.
For example, while one may be able to gain fairly accurate estimates of regional water usage, estimating the amount of water embodied in different industry supply chains, and that embodied in international trade is fraught with difficulties. Organisations such as the OECD are working hard to provide better estimates of direct and indirect water use by different nations.
Any footprint is an estimate, and more enlightened studies report footprints as a range of estimates.
The estimation of water footprints also present some of the same problems that are common with the life cycle analysis of commercial, industrial and household waste. Water can be recycled and reused, and different types of water are consumed by industries and households (i.e. potable, non-potable, and then issues of blue, green and grey water usage covered above).
For policy purposes linked to managing the resource, any initial estimation of a water footprint would usually need to be linked through to different treatment options, and these same options vary in price and efficiency from one place to another.
The point is that the assessment of a water footprint can only be a first step to a framework that explores water resource management. The value of the approach is actually more in terms of making us think about the more global implications of different consumption patterns.
Some examples to illustrate the concepts
You are not expected to read all of these examples. They are here for further reading.
1. Water footprint of nations (Mekkonen and Hoekstra, 2011,2012)
This is one of the most comprehensive pieces of research undertaken to date on the estimation of national water footprints, and also provided an analysis of potential international virtual water flows and national and global water savings resulting from trade. Key findings were that:
- The global water footprint 1996-2005 was just over 9,000 Gm3/yr (of which around three quarters was green water).
- Agricultural production accounted for over 90% of the global footprint, and with around 20% of the footprint accounted for production for export overseas.
- International virtual water flows related to trade were dominated by crop products
- Average US consumers had a water footprint of 2842 m3/yr, close to three times the average for China and India. Many European states were found to be heavily dependent on water consumption and pollution elsewhere around the globe.
View the water footprint of nations research
2. UK water footprint
A key study for the UK is Chapagain and Orr (2008) who estimated the water footprint for the UK economy. They estimated this to be 102 Gm3 (billion cubic metres) per year or 4,645 litres per person per day. The footprint broke down to agricultural products, 3,400 litres per person per day, and with cotton alone representing 211 litres per person per day; industrial products, 1,095 litres per person per day; and household water, 150 litres per person per day.
These figures embraced internal (the water used from inside the UK to grow the food consumed in the UK) and imported goods. Chapagain and Orr estimated that the UK was 62% dependent on water from elsewhere in the globe and was found to be the sixth largest net importer of virtual water based on the water footprint of agricultural products.
View the UK water footprint PDF
3. Water footprints of foods consumed in Wales
Some early research on water footprinting in Wales examined particular food groups: lamb (Wales and New Zealand), potatoes (Wales and Israel) and tomatoes (Wales and Spain). Blue and Green water use were considered in this analysis but Grey water was excluded. The assessments were illustrative case studies based on individual farm data and did not represent average impacts for food items in particular regions or countries.
A comparison of the total water footprint is shown below in the graphs. This research provided a volume based footprint but then a stress-weighted footprint, allowing for environmental considerations in the host state.
The potato example is interesting revealing that the volume water footprint (megalitres per tonne) is greater in Wales than Israel, but the stress weighted footprint of water is clearly higher in Israel. In the case of lamb there is much less difference between the estimates.
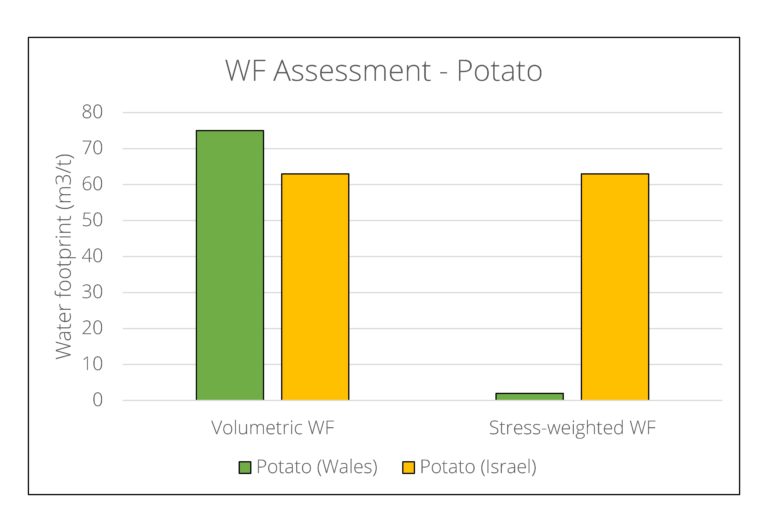 Graph showing the water footprint of potato
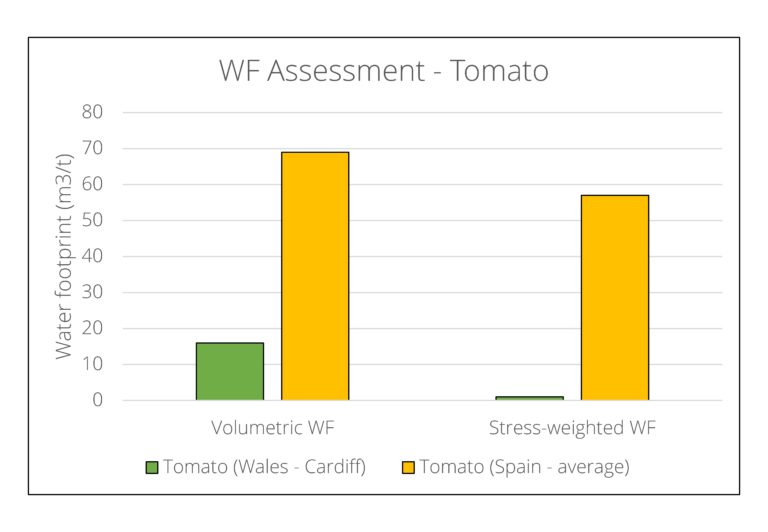 Graph showing the water footprint of tomato
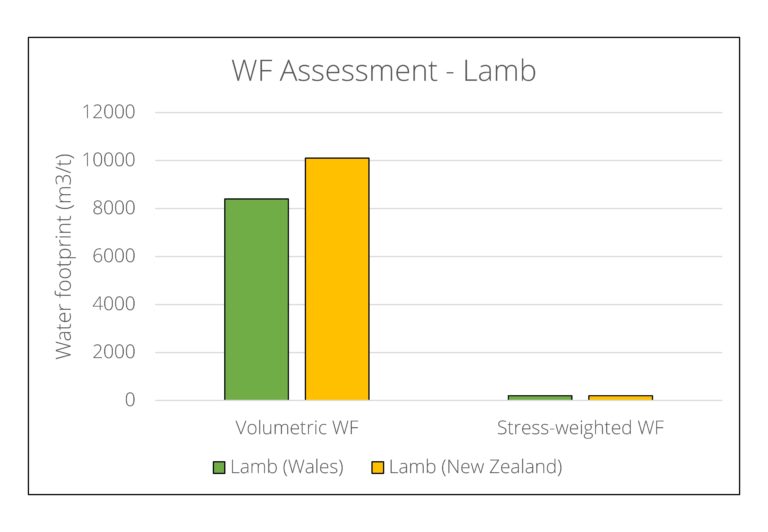 Graph showing the water footprint of lamb
Green water was found to dominate the water footprint for both Welsh lamb and potatoes. The total water footprint of tomatoes and 7% of Welsh potato production was shown to consist of blue water consumption as a result of irrigation requirements. Blue water consumption had the largest potential impact on water resources in Wales.
Clearly, care needs to be taken in using these type of analyses to inform policy choices; the consumption choices for these commodities reflect seasonality, price, and supply-side conditions. Simply, in the case of tomato and potato it is unlikely that Welsh production could meet annual Welsh demand. However, such analysis is valuable for awareness raising.
In the next step we’ll be asking you to discuss your own water footprint.


Reach your personal and professional goals
Unlock access to hundreds of expert online courses and degrees from top universities and educators to gain accredited qualifications and professional CV-building certificates.
Join over 18 million learners to launch, switch or build upon your career, all at your own pace, across a wide range of topic areas.


