
Beyond principal component analysis
The high-dimensional and wide data tables that are encountered in metabolomics can be difficult to analyse, but the metabolomics community is now routinely applying many techniques to interrogate these large data sets and increase our understanding of the changes in metabolism. The use of data reduction or dimension reduction methods to reduce the size of the data table (while minimizing information loss) before further statistical analysis takes place is extremely important in this respect. The previous step discussed a popular dimension reduction method, namely principal component analysis (PCA).
PCA is an example of a so-called unsupervised technique. This means that the method does not use class label information (i.e. to which group does each sample in the data table belong). This has important consequences for dimension reduction. Remember that dimension reduction is achieved by a rotation of the data followed by mathematical projection to a lower dimension (shining with a light on my hand and looking at the shadows on the wall) resulting in a small data table. PCA rotates the data such that the largest differences between the samples are highlighted (the largest shadows appear on the wall). This is very useful for explorative analysis of the data, for example, to detect outliers.
Sometimes, the PCA model highlights differences between specific groups of samples that we are interested in, but this is not always the case. This is due to the fact that PCA does not specifically take group-information into account. The method focuses on differences between samples. In other words, it may not focus on differences between groups of samples when the differences between samples within a group are much larger. This occurs, for example, when the normal metabolic variation between humans is much larger than the metabolic disruption caused by a disease.
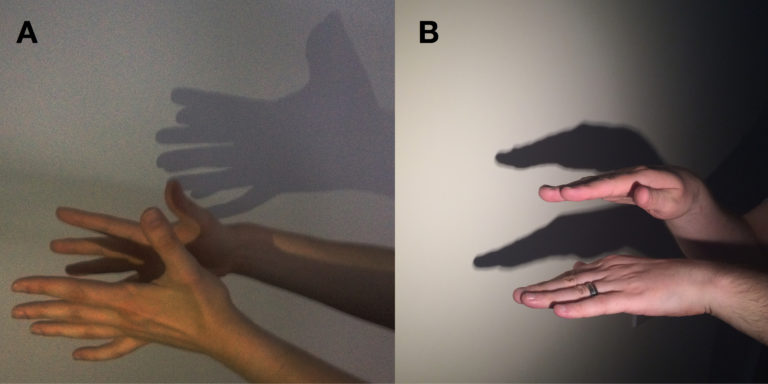
In the figure above the two hands represent two groups of samples. The difference between the groups is represented by the distance between the hands and the differences between samples within a group are represented by the distances within a hand (e.g. between two fingers). To carry out PCA we rotate the hands and maximize the shadows on the wall. The solution is shown in panel A. As expected, the relatively small difference between the hands is not visible.
To resolve these issues so-called supervised data reduction methods have been developed. These models already know to which group a sample belongs before dimension reduction takes place. This information can be used to detect group differences, for example, by rotating the data such that the shadows show the largest differences between groups relative to the sample differences within groups. Panel B shows the solution of this approach for the two-hand example.
Partial least squares – discriminant analysis (PLS-DA) is one of the most popular supervised data reduction techniques in metabolomics. For illustration we will apply PCA and PLS-DA to the data from the Calanus study described in week 2 (Copepods, climate change and metabolomics). As part of this study, samples were collected over time to study the effects of starvation. Here, we focus on the difference between the samples at day zero (pre-starvation) and day five. With both methods the initial data table with 2487 columns (peaks) was reduced to a table with a few columns (2 – 4). The figure below shows scatter plots of the first two columns of the reduced data tables. It is clear that the PLS-DA model highlighted the difference between the two time points much more clearly compared to PCA.
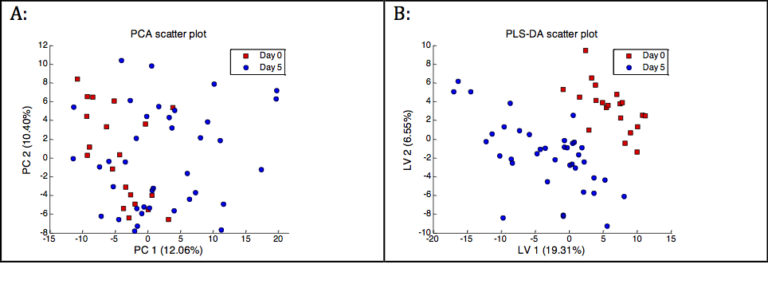
Direct interpretation of PLS-DA scatter plots such as in panel B is not without risk. Typically, the observed group-separation is overoptimistic. For example, sometimes random noise is used to tell the groups apart. Most likely, much pooper results would be obtained when the same model would be applied to new data, since this data will have a different noise pattern. Therefore, the application of a supervised analysis method is always followed by validation steps to make sure that the observed differences are significant and generalize well to new data. Validation in its simplest form involves splitting the data table into 2 sets: a training set (e.g. the first 20 rows of the data table) and a test set (e.g. the last 10 rows of the data table). The training set is used to construct the model. The test set is ‘blind’ to the model building and only used to assess how well the constructed model generalizes to new data.
To summarize, in a typical metabolomics experiment huge and complex data tables are obtained. As shown in the previous steps these tables are very difficult to interpret without the right tools. It was shown that unsupervised (PCA) and supervised (PLS-DA) methods are very useful to assist in the biological interpretation of the data. However, they are by no means the only methods that can be (and are) employed in metabolomics. More details can be found in the following:
Trygg, Johan, Elaine Holmes, and Torbjoern Lundstedt. Chemometrics in metabonomics. Journal of proteome research 6.2 (2007): 469-479.
Goodacre, Royston, et al. “Proposed minimum reporting standards for data analysis in metabolomics.” Metabolomics 3.3 (2007): 231-241.
Metabolomics: Understanding Metabolism in the 21st Century


Metabolomics: Understanding Metabolism in the 21st Century
Reach your personal and professional goals
Unlock access to hundreds of expert online courses and degrees from top universities and educators to gain accredited qualifications and professional CV-building certificates.
Join over 18 million learners to launch, switch or build upon your career, all at your own pace, across a wide range of topic areas.


