
Monitoring Nutrition: the National Diet and Nutrition Survey

If each of us were to keep an accurate record of all the foods and drinks we consume over a number of years, we would be able to see patterns in what we eat, not only from day to day or from week to week, but also seasonal and longer-term changes in our diet.
Just knowing what foods we eat might be interesting in itself, but from systematic records of our food consumption, nutritionists can also calculate the amounts of a wide range of individual nutrients in our diet using food composition tables. With records of food consumption from large groups of people, population trends can be seen, and national governments around the world regularly conduct surveys of diet and nutrition for a variety of purposes.
The National Diet and Nutrition Survey
In the UK, the National Diet and Nutrition Survey (NDNS) has assessed the dietary habits and nutritional status of adults and children aged 1.5 years and above since the 1990’s, with data on British adults from 1986. It collects data across a representative sample of around 1,000 individuals from private households across England, Wales, Scotland and Northern Ireland every year. In the early surveys, participants had to weigh all the foods they ate, but now they fill out a food diary over 4 days. This methodology allows high-quality data to be generated rapidly and trends can be analysed every 2-3 years.
There are two stages to the survey, with an interview visit followed by a nurse visit around 8 – 12 weeks later. The interview collects demographic and socio-economic characteristics, information on physical activity, oral health, general health and lifestyle, and a spot urine sample. The nurse visit includes measurements including height, weight and blood pressure, and a blood sample is collected for laboratory analysis of nutritional, metabolic and cardiovascular status. If any results identify clinically relevant information then they are reported back to the participants or their doctor according to the terms of study consent.
The NDNS is a powerful tool that can assess the adequacy of food and nutrient intake and of nutritional status in different groups of the population. It forms an important part of the evidence that is used to formulate and to monitor responses to healthy eating advice. Data from the survey also allows the Food Standards Agency to assess the population’s exposure to chemicals added to foods such as preservatives, colourings and flavourings.
The figures below show a summary of some data on red meat, calcium and vitamin D intake in the UK from to the NDNS 2008/9 – 2011/12. In both figures, the yellow area shows the range of average daily intakes from individuals in the sample, the red dashed line shows the average daily intake across the whole sample, and the blue line shows the recommended daily intake for the nutrient.
Red meat
Red meat is a good source of proteins, needed for musculoskeletal energy and maintenance, and of vitamins and minerals.
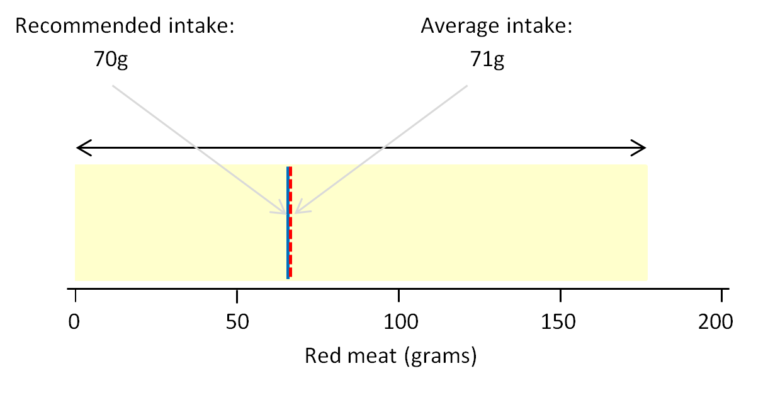 The daily intake of red meat (reproduced from the MRC publication ‘What do UK adults eat?’ – CC BY 4.0)
It can be seen from the NDNS data that some individuals ate no red meat at all while others were consuming up to 175 grams on average per day. On the whole, the population is consuming on average just 1 gram per day more than the recommended intake. There is nothing wrong if individuals do not eat red meat if they are obtaining proteins, vitamins and minerals from other food sources. However, eating a lot of red and processed meat has been strongly associated with an increased risk of bowel cancer, and it is recommended that people who eat more than 90g of red and processed meat a day should cut down to 70g per day.
The most recent analysis from Years 7 and 8 of the rolling Programme (2014/15 – 2015/16), shows that women aged 19 and over on average met the current recommendation of less than 70g per day. However, men aged 19 and over on average exceeded the recommendation. There is an indication that women have reduced meat consumption since the start of the rolling programme but this is not the case for men.
Calcium
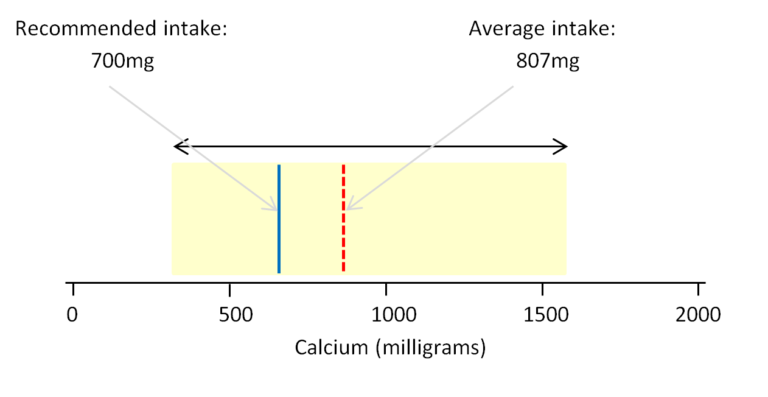 The daily intake of calcium (reproduced from the MRC publication ‘What do UK adults eat?’ – CC BY 4.0)
The NDNS shows that that average daily intake of calcium by individuals ranged from about 300mg to just over 1500mg per day. The red dashed line shows that the population as a whole is achieving an average of 807mg of calcium per day from the diet. This figure is just a little above the 700mg recommended intake and the upper range of intakes across the population lies within limits considered to be safe. However, some individuals are achieving intakes of calcium that are quite low and might then be at risk of poor musculoskeletal health.
The LRNI for calcium for adults is 400 mg/day. The latest NDNS data from Years 7 and 8 of the rolling Programme (2014/15 – 2015/16) shows that on average, calcium intake of 3 – 4 % of men and around 8% of women aged 19 and over have calcium intakes from food sources that were below the LRNI. Of particular concern is that nineteen percent of girls and twelve percent of boys aged 11 to 18 years had calcium intakes from food sources that were below the LRNI, and the figure for boys has increased since the previous analysis. We have mentioned the importance of adequate calcium intake for teenagers for building a healthy skeleton in previous steps, and low intakes during this period can result in low peak bone mass in adulthood and consequent long term skeletal problems such as osteoporosis.
Vitamin D
The NDNS data from Years 7 and 8 of the rolling Programme (2014/15 – 2015/16) shows evidence of low vitamin D status (as indicated by low plasma 25- hydroxy vitamin D (25-OHD) concentrations in blood) in all age groups. 17% of adults aged 19 to 64 years, 13% of adults aged 65 years and over and 26% of children aged 11-18 years had low vitamin D status over the year as a whole.
Mean vitamin D intakes from food sources were below the recommendation of 10 µg/day in all age groups, at around a fifth of the recommendation in children and a quarter to a third in adults. When intakes of vitamin D from supplements were taken into account mean intakes increased to around 25-35% of the recommendation for children and 40-60% for adults.
This data for vitamin D from Years 7 and 8 of the rolling Programme will be a very important baseline from which we can monitor any impact of the new guidelines for vitamin D intake in the UK population.
The Musculoskeletal System: The Science of Staying Active into Old Age


The Musculoskeletal System: The Science of Staying Active into Old Age
Reach your personal and professional goals
Unlock access to hundreds of expert online courses and degrees from top universities and educators to gain accredited qualifications and professional CV-building certificates.
Join over 18 million learners to launch, switch or build upon your career, all at your own pace, across a wide range of topic areas.


