
Agent Based Modelling
Agent Based Modelling in one the major tools of complex systems science. In this case the agents are considered to be people. As you will see the epidemic and its curves emerge from the interactions between the people.
The colour codes are:
Play though the video and you will observe blue, red and grey circles moving around the screen. These dots are the agents in our Agent Based Model. Some researchers give very precise definitions as to what can be considered an agent and, of course, they disagree. For them moment we’ll say the agent dots are people.
The simulated people are all moving around the simulated world. In fact they all have random directions and speeds.
At the beginning of the simulated epidemic no-one has the virus. The susceptible people are represented by blue dots. After a few steps an infected person enters the community. Infected people are shown by red dots. You will have to watch attentively because that single person very quickly infects a lot of others, and that triggers the epidemic.
In the simulations a person infects another if they pass within a given distance. On becoming infected a person can immediately infect another person. After a period of time an infected person becomes recovered, and they change colourfrom red to grey.
As you watch the epidemic quickly takes hold with a lot of red dots proliferating on the right. On the left is the uninfected blue community that the infection has not yet penetrated.
During the simulation three curves are traced out. The red curve shows the proportion of agents who are infected, the blue curve shows the proportion who are susceptible and the grey curve shows the proportion of agents who have recovered. As you can see the microlevel simulation creates the same kind of curve as the macrolevel Kermack McKendrick model.
The simulations progress according to the tick of the system clock. The fundamental idea is that there are rules expressed in logical statements or rules that change the state of the system at time t to time t+1 one ‘tick of the clock’ later. A tick of the clock can represent a second, a minute, and hour, a day, a month, a year, or any interval of time. The transformation can be written as
(large{Rules})({large{:}}) (large System ; at ; time ; t ;; rightarrow ;; System ; at ; time ; t+1)
Figure 5.1 shows four snapshots of the simulation. It is very hard to see any different between time 100 and 101. Even after ten tick of the clock the configuration at time 110 is similar to that at time 100. After Fifty clicks it is clear that the system is changing.
Figure 5.1. The agents move a little at step in the simulation 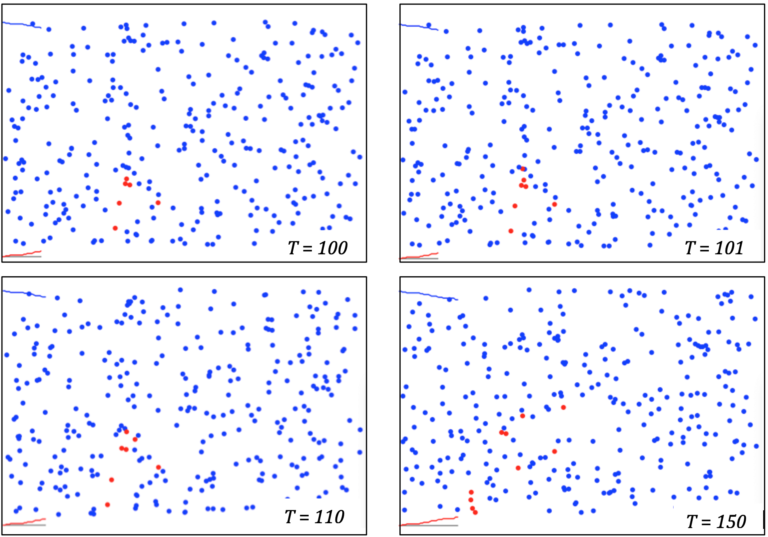
Interactive simulation model
We are working on an interactive simulation model. The model should be completed and working later this week.
In the meantime take a look at the animations on this site – you don’t have to read the whole article – just look at the animations which give an excellent intuition on virus spread (use Control click to see it in a different tab or window):
Harry Stevens animations explaining how epidemics spread
These kinds of models are widely used in the complex systems community. A famous early example is Thomas Schelling’s experiment on the formation of racial clusters in cities. Schelling argued that this does not necessarily reflect racism views but could result from a mild preference for not being racially isolated.
Take a look at this video (use Control click to see it in a different tab or window):
https://www.youtube.com/watch?v=JjfihtGefxk
in which Tim Harford explains the idea.
What do you think
Do you think coloured dots moving around the screen is a good model of people interacting and infecting each other? What assumptions are made about the agents all being the same? Do such models in any way connect with reality?
Reference
Harry Stevens, ‘Why outbreaks like coronavirus spread exponentially, and how to “flatten the curve”’, The Washington Post, March 14, 2020. https://www.washingtonpost.com/graphics/2020/world/corona-simulator/
COVID-19: Pandemics, Modelling, and Policy

Reach your personal and professional goals
Unlock access to hundreds of expert online courses and degrees from top universities and educators to gain accredited qualifications and professional CV-building certificates.
Join over 18 million learners to launch, switch or build upon your career, all at your own pace, across a wide range of topic areas.


