
Introduction to Week 1

The Black Death took about five years to spread throughout Europe from China. It has taken the Covid-19 epidemic about five months to do the same. This course concerns the challenges this has created for governments, and the modellers who forecast the possible outcome of policies and plans for the future.
Covid-19 is a disease caused by a new strain of coronavirus, SARS-CoV-2. It appeared in China in December 2019 [1]. Since it is a virus it cannot be treated by antibiotics [2]. The World Health Organisation publishes regular information on the pandemic [3] but in May 2020 much is still unknown.
Despite the lack of knowledge, citizens and governments want to know what might happen. For example, people could ask
- How many people will be infected and how many will recover?
- How many people will die?
- How likely is it that I or a loved one will die?
- How different is this from the usual seasonal illnesses and morbidity rates?
- Why don’t we just let the virus take it’s natural course?
- Why did we need the lock down? When can it be ended?
- Is it safe to relax lockdown now?
- When can I see my friends, children and grandchildren again?
- When is the best time for me to stop isolating?
- Does my government have the right policies?
Welcome to the evolving course
This course is intended to help participants understand how computer modelling can help politicians and their scientific advisors make policy on COVID-19. This is happening in real time! We view policy modelling from the perspective of Complex Systems Science. This explains why things like pandemics are hard to predict, and what kinds of forecasts can be made with confidence.
You don’t need any specialist scientific knowledge to do the course. It is written to be accessible to everyone – if things are not clear and easy to understand please tell us. With your input the course will evolve as the pandemic progresses over the months. The learning outcomes for the course are as follows:
- Learning Outcome 1: You will be able to explain the currently accepted facts and statistics of COVID-19 such as the incubation period, recovery time and basic reproduction rates.
- Learning Outcome 2: You will be able to explain what models are and how they are used in policy making
- Learning Outcome 3: You will be able to model the COVID-19 pandemic using computational methods including time series and implementations of the SIR (Susceptible, Infected, Recovered) model
- Learning Outcome 4: You will be able to evaluate and critique models and computer modelling in a policy context
- Learning Outcome 5: You will be able to explain the difference between macro-modelling at the level of a whole population, micro-modelling at the level of the individual, and meso-modelling at the level of organisations and social events.
- Learning Outcome 6: You will be able to evaluate reports used to guide policy and explain how policy makers must deal with conflicting scientific evidence.
FutureLearn allows you to make comments and we strongly encourage you to join in the discussions. You may be an expert who knows more about something – if so please tell us. If you have a question or want clarification please post a message and usually someone will answer. We welcome controversial postings and the rich discussions they generate. All we ask is that everyone keeps it honest, decent, and legal.
The International Perspective
We expect people from all over the world to participate in this course. This first version takes most of its examples from the UK. However the UNESCO UniTwin Complex Systems Digital Campus is an international organisation. We have a special focus on Africa and Latin America and will particularly welcome input and suggestions from these regions. But we welcome input from anywhere in the world. COVID-19 is a challenge for all of us no matter which country we are in. With your help the course will evolve with examples from many countries. Let’s work together to make this course as useful as it can be across the world.
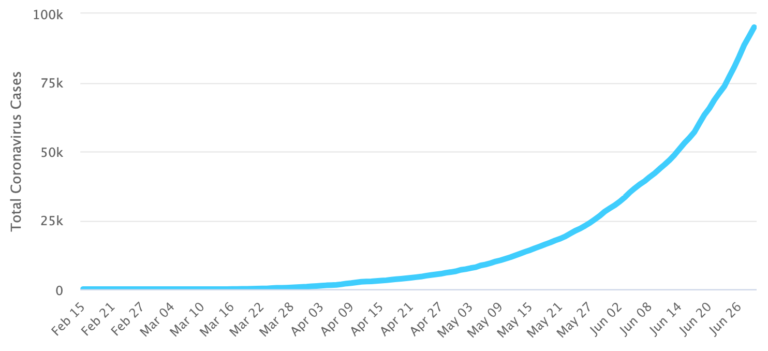
Here is the number of cases reported for Colombia on 29th June 2020:
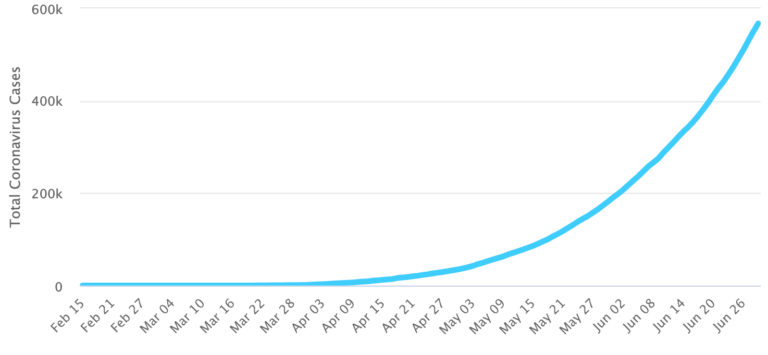
Here is the number of cases reported for India on 29th June 2020:
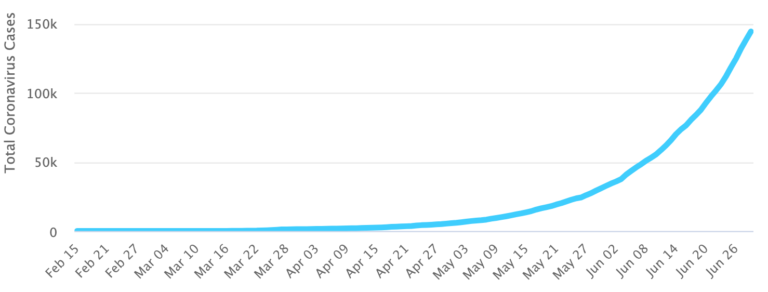
Here is the number of cases reported for South Africa on 29th June 2020:
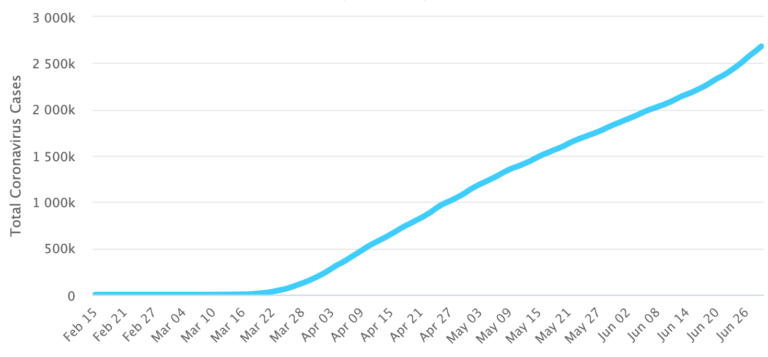
Here is the number of cases reported for the USA on 29th June 2020:
Here is the number of cases reported for the UK on 29th June 2020:
Policy, graphs and data
The curves above give the infection rates for some countries around the world. The curves for Colombia, India and South Africa all show the disease going through the ‘exponential’ phase with the number of cases increasing day by day. The curve for the USA becomes more like a straight line with the number of new cases each day about the same. The curve for the UK has turned down so that the number of new cases each day is decreasing.
Policy makers interpret these curves in this way. The challenge is to forecast the behaviour of the curves in future. How will any particular policy change the curves? Modellers try to answer this question to help politicians understand better the consequences of policies between doing nothing to total lockdown. All policies have positive and negative outcomes. Doing nothing results in many deaths. Total lockdown results in massive social and economic disruption that cannot be sustained beyond a few months.
Modelling suggests that, in the absence of a vaccine, the pandemic will be with us for at least a year. Modelling will inform politicians as they try to balance social and economic needs against healthcare needs and minimising the number of deaths.
What do you think?
So, before going further tell us what you think. Are you worried for yourself or your loved ones? Or do you think it’s all a lot of fuss about nothing? Is the scientific community doing a good job ? Do you think computer models can help? Is the pandemic being handled well in your country? Let us know what you think in the comments.
Most steps in the course will end by asking you what you think. We make some provocative suggestions but you are not expected to react to all or any of them. You will probably have your own ideas. We would like you to write your reactions in the comment boxes.
References
[1] Chaolin Huang et al, ‘Clinical features of patients infected with 2019 novel coronavirus in Wuhan, China’, The Lancet, Vol 395, Issue 10223, 497-506, 15-Feb-2020 https://www.thelancet.com/journals/lancet/article/PIIS0140-6736(20)30183-5/fulltext
[2] John Hopkins University, ‘Antibiotics’, https://www.hopkinsmedicine.org/health/wellness-and-prevention/antibiotics
[3] World Health Authority ‘Coronavirus disease 2019 (COVID-19), Situation Report – 73 2 April 2020. https://www.who.int/docs/default-source/coronaviruse/situation-reports/20200402-sitrep-73-covid-19.pdf?sfvrsn=5ae25bc7_2
COVID-19: Pandemics, Modelling, and Policy

Reach your personal and professional goals
Unlock access to hundreds of expert online courses and degrees from top universities and educators to gain accredited qualifications and professional CV-building certificates.
Join over 18 million learners to launch, switch or build upon your career, all at your own pace, across a wide range of topic areas.


