
Critiquing the model

When building models it is essential to be self-critical. The model built in the previous two steps fits the data well but is very poor for a number of reasons.
A first criticism of the model is the part that uses an exponential function until 4th April. As Figure 8.2 shows, this part of the model can give very misleading forecasts. Although the exponential model makes a reasonable assumption about the process of disease transmission in the early stages when most members of the population are not infected, small errors in estimating the exponent can result in large errors in the forecast.
A second criticism of the combined model is that there is a ‘sleight of hand’. Changing from the exponential to a linear relationship gives good results in retrospect, but until 4th April there was nothing in the data to suggest that the relationship would change. In other words there was no ‘meta-prediction’ that the relationship would change.
Why did the relationship change from exponential to linear? The reason is not in the time series data. On 23rd March the British Government announced its lockdown policy requiring most people to stay at home.
Before the lockdown policy was announced on 23rd March many thousands of people were in close contact at sports and other events, and in restaurants and pubs. This provided perfect conditions for an epidemic to spread, and no doubt contributed to the exponential relationship in the data. Twelve days after the lockdown the the data show the linear relationship observed above.
So, the change in the observed curve was due an exogenous cause. This is another way of saying that factors relevant to the system being modelled are not included. Thus the change in the curve was not predicted, and could not have been predicted, by my simple time series model.
A final criticism of my time series model is that it does not model the process of the epidemic. The model is macroscopic – it operates at the level of the whole country. The virus operates at the microlevel of the individual person and the mesolevel of social interaction. Ideally the patterns of infection would emerge from modelling the process of the epidemic. This would allow policy options to be investigated before they were implemented.
Imperfect but the best we have
This activity may have given a negative view of models and modelling. But only by being self-critical can we understand the potential benefits of modelling and use models in appropriate ways.
There is an extensive literature on time series analysis and it is very useful for modelling systems with periodic processes, e.g forecasting the demand for ice cream, holidays, fuel, and warm and cool clothes.
There are many ways to model the phenomena in the social world. To use modelling well it is essential to know the assumptions made by the modellers. If the system under investigation does not meet those assumptions then the model should not be used.
One problem with modelling is that the modellers sometimes disagree. This is inevitable and policy makers need to understand this. They must expect to question the assumptions underlying the models used by their advisors.
The argument in favour of models is that they are the best we have for forecasting events in the future. The alternative to evidence-based policy is policy that ignores or contradicts the available evidence. Models are better than hunches or blind certainties. Sometimes models can tell us that things are impossible to forecast reliably and sometimes they can’t. One policy implication is that if you have no way of knowing the outcome of a policy, don’t implement it. Of course sometimes action has to be taken in the face of great uncertainty, and models can make explicit or even reduce the uncertainty.
Used properly models are the best way to forecast the future and provide the best available foundation for policy. They may be imperfect but they are the best we have.
A Modelling Exercise
Figure 10.1. The graph of UK Active Cases to 2nd May 2020. 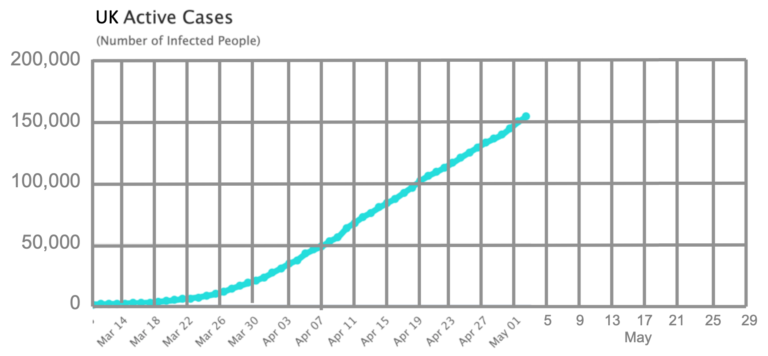
Figure 10.1 shows the graph of active cases in the UK. Use your best modelling skills to answer the following question:
- when, if ever, will the number of active cases in the UK reach 200,000 infected people?
Make a note of your answer. You will need it in the poll in the next step.
What do you think
Is extrapolating from time series data a good way to forecast what will happen. What are the drawbacks to the approach – what are its strengths and weaknesses? Can you think better ways of forecasting the future?
COVID-19: Pandemics, Modelling, and Policy

Reach your personal and professional goals
Unlock access to hundreds of expert online courses and degrees from top universities and educators to gain accredited qualifications and professional CV-building certificates.
Join over 18 million learners to launch, switch or build upon your career, all at your own pace, across a wide range of topic areas.


