
What is the SIR Model?

In this step we’ll explain what the SIR model is and how it works.
Later we’ll give the formal mathematical details of the Kermack-McKendrick SIR model, but the general ideas behind it can be expressed in words.
What Does SIR Mean?
You may already have seen the three numbers (S), (I) and (R) relating to susceptible infected and recovered people at any given time. There are two more numbers in the model:
- the infection rate
- the recovery rate
The infection rate is the number of people infected in a given time and the recovery rate is the number of people who go from being infected to having recovered in a given time. It is a simple argument that:
(infection ; rate ; < ; recovery ; rate ; 😉 implies the epidemic will die out
(recovery ; rate ; < ; infection ; rate ; 😉 implies the epidemic will spread.
and this is behind the definition of R0 which we have heard so much about recently. At the beginning of an epidemic:
[large ; ; R_0 ; ; stackrel{rm{definition}}{ =} ; ; frac{; infection ; rate ; ; }{ recovery ; rate }]
This is consistent with the definition given previously. If the infection rate is high then R0 is large. If the recovery rate is high R0 will be lower.
You can experiment with these values to see what impact a high and low R0 have on epidemics.
Experiment 4: Manipulating beta, gamma & R0
Most of what we have to say on the COVID-19: Pandemics, Modelling, and Policy course does not need any mathematics and we are trying to keep this to a minimum. This exercise involves the infection rate and the recovery rate which historically have been expressed using the Greek symbols beta, written as (beta), and gamma, written as (gamma). You will use these numbers in the exercise but it’s really arithmetic rather than maths.
SIR Calculations
For example in our simulation we start with the default values of 0.25 for the infection rate and 0.1 for the recovery rate. Letting beta (the infection rate) be 0.25 means, roughly speaking, that a quarter of interactions in a given time will result in the virus being passed on. Letting gamma (the recovery rate) be 0.1 means that about a tenth of the infected people are recovering in that time.
The formula R0 = beta/gamma gives R0 = 0.25/0.1 = 2.5. This is in the middle of the range of the empirical values of R0 for COVID-19 that we saw last week. [On 16th June it seems that in the UK R0 was higher with value 3.0 or more].
Hopefully you will be uninhibited in changing the beta and gamma values to get high and low values for R0.
To see the interactive computer program in a new window CTL click here.
In this experiment you can manipulate the values of beta and gamma to answer the following question.
- what is the difference in the shape of the curves for high and low values of R0?
The screen shots below show some of the shapes I saw as I manipulated beta and gamma to get high and low values of R0 .
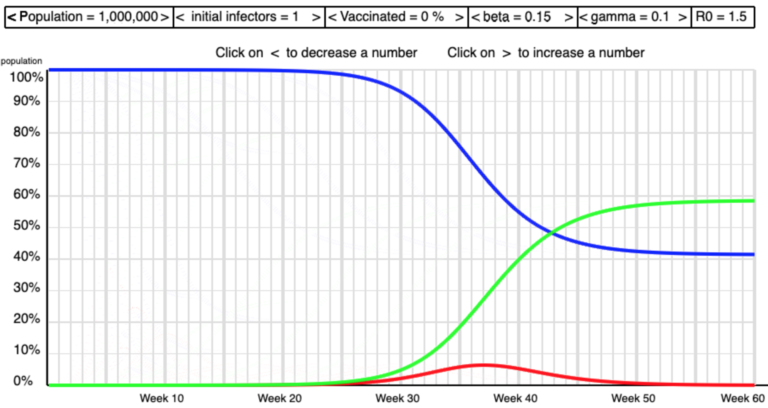 Low R0
 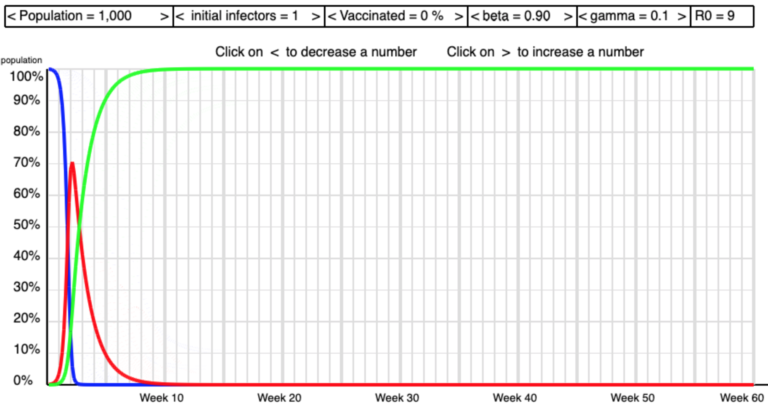 High R0
A Summary of the Mathematical Model
This sub-section is included for people who really do like to look ‘under the hood’ and get their hands dirty. It is not an essential part of the course and it won’t be assessed.
If you are not confident with mathematical notation you can skip over the formulae.
The original article by Kermack and McKendrick was published in 1927 [1]. Interest in the model was rekindled by a paper by Anderson and May in 1992 [2]. When I wrote the computer model I found Hill’s description of his program very helpful [3].
The Kermack-McKendrick SIR Model
The Kermack-McKendrick model is an SIR model for the number of people infected with a contagious illness in a closed population over time. It assumes that the population size is fixed (i.e., no births, deaths due to disease, or deaths by natural causes), incubation period of the infectious agent is instantaneous, and duration of infectivity is same as length of the disease. It also assumes a completely homogeneous population with no age, spatial, or social structure.
The model consists of a system of three coupled nonlinear ordinary differential equations,
[; ; ; ; ; ; ; ; ; ; ; ; frac{dS}{dt} = frac{-beta S I}{N}]
[; ; ; ; ; ; ; ; ; ; ; ; frac{dI}{dt} = frac{beta S I}{N} – gamma I]
[; ; ; ; ; ; ; ; ; ; ; ; frac{dR}{dt} = gamma I]
where (t) is time, (N) is the (fixed) population, (S(t)) is the number of susceptible people, (I(t)) is the number of people infected, (R(t)) is the number of people who have recovered and developed immunity to the infection, beta ((beta)) is the infection rate, and gamma ((gamma)) is the recovery rate.
The key value governing the time evolution of these equations is the so-called epidemiological threshold,
[; ; ; ; ; ; ; ; ; ; ; ; R_0 = frac{beta}{gamma}]
The R-number Versus (R_0)
There is some ambiguity over (R_0) in the media. (R_0) is defined as an initial measure of infectiveness of a virus. Although it depends on geography and culture it gives a measure before any policy interventions. The notation (R_t) giving the ‘R-number’ at time (t) is attractive but not widely used. Instead journalists, politicians and their advisors seem to have settled on the term ‘R-number’ so that’s what we will use.
Thus the objective of policy is “to reduce the R-number”. In practice this means to reduce beta or increase gamma. Beta, the infection rate, can be reduced by policies such as social distancing, hand washing, and lockdown. Gamma, the recovery rate, depends on the biology of infection. In theory it might be changed by drug therapies or other treatments.
A government pamphlet gives a simple description of the R-number [4].
What do you think?
We tried to explain this as clearly as possible in words. Assuming that you skipped the maths, do you think that most people would be able to understand the basic ideas of this model and the qualitative conclusions that can be drawn from it? Do you think the underlying assumptions of the model are realistic? Do you understand R0 a bit better now?
References
[1] W. O. Kermack andA. G. McKendrick, ‘A contribution to the mathematical theory of epidemics’, Proc. R. Soc. A, 115, 772 (1927)
[2] R. M. Anderson and R. M. May, Infectious Diseases of Humans: Dynamics and Control, OUP (1992).
[3] Christian Hill, ‘The SIR epidemic model’, https://scipython.com/book/chapter-8-scipy/additional-examples/the-sir-epidemic-model
[4] assets.publishing.service.gov.uk, ‘R explainer’, viewed 25-JUNE-2020, link to pamphlet
COVID-19: Pandemics, Modelling, and Policy

Reach your personal and professional goals
Unlock access to hundreds of expert online courses and degrees from top universities and educators to gain accredited qualifications and professional CV-building certificates.
Join over 18 million learners to launch, switch or build upon your career, all at your own pace, across a wide range of topic areas.


