
Displaying PPS data
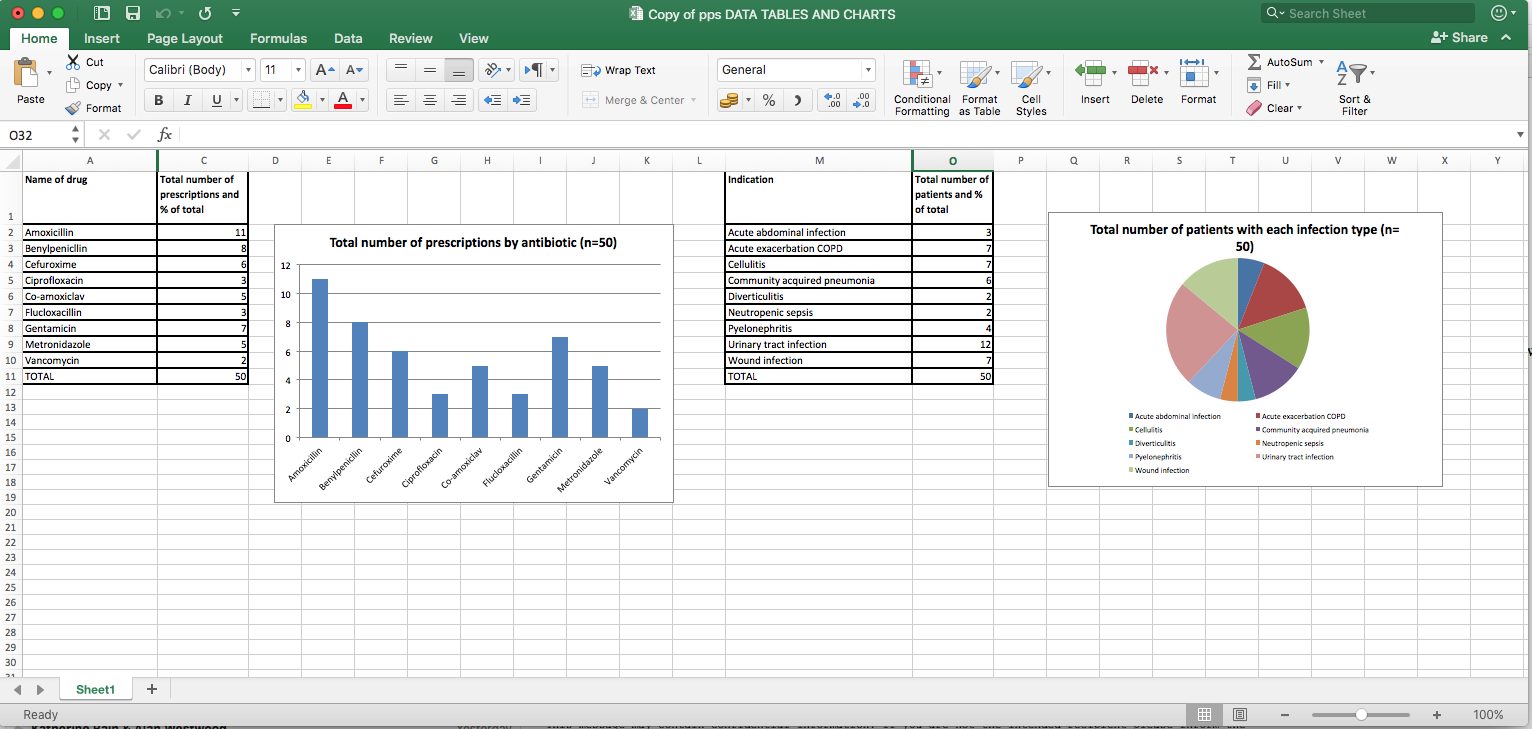
We can aggregate data from the patient level forms as shown previously in Step 2.5, then use this data within Microsoft Excel, or another spreadsheet software (e.g OpenOffice, Google sheets, Numbers) to create charts to illustrate the data more effectively when sharing with others.
If you want to know more about using Microsoft Excel to create charts you can find information here.
Here are some examples of charts used to display the data from a small hospital described in the previous steps.
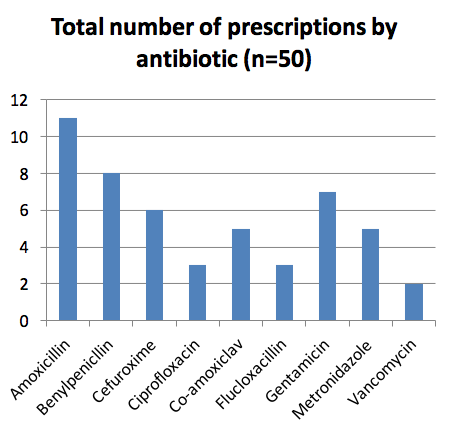
This bar chart shows which antibiotics are being used in the hospital.
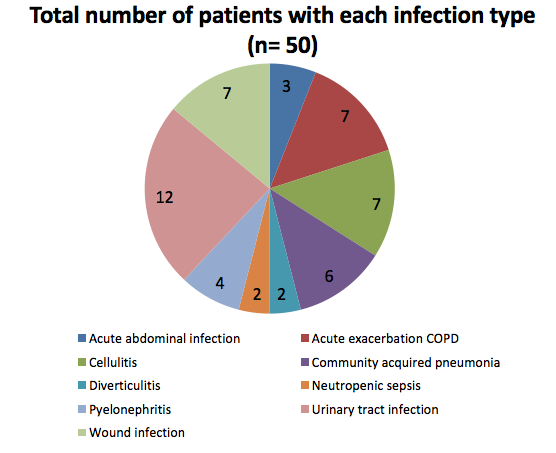
This pie chart shows the types of infections that are being treated in the hospital.
The Excel spread sheets from which these charts were created are here.
Here are some other ideas for how to utilise data from PPS:
• Prevalence of patients on one antibiotic, two antibiotics, three or more antibiotics. This gives information about use of combination therapy
• Use of IV route by ward
Most patients only require IV therapy for a short time, so high rates of IV antibiotics suggest failure to review and switch to oral
If you would like to learn more about IV to oral switch, you may find the BSAC FutureLearn course on Intravenous To Oral Switch interesting and useful for your practice.
• Compliance with local policy
Poor compliance may be due to lack of awareness, common infections not being included in the policy or lack of clinician agreement with the policy antibiotic choice.
Data on use of antibiotics as surgical and medical prophylaxis can also be captured during a PPS and analysis of this data can also produce useful results to share with clinicians.
Duration of surgical prophylaxis is an important measure since for most procedures, only one dose of antibiotic is required and this will be stipulated in local policies. The % procedures where >1 dose is used is a useful measure to benchmark surgical specialities and identify where excess doses are being used.
Medical prophylaxis is also an area where antibiotics may be overused, e.g. daily antibiotics for urinary tract infection. A growing body of evidence and hence local policies recommend that course length for this indication should not exceed 6 months, so high levels of use suggest failure to discontinue prophylaxis. Compliance with prophylaxis policy for indications such as splenectomy and cancer chemotherapy can also be measured via a PPS.
Challenges in Antibiotic Resistance: Point Prevalence Surveys


Challenges in Antibiotic Resistance: Point Prevalence Surveys
Reach your personal and professional goals
Unlock access to hundreds of expert online courses and degrees from top universities and educators to gain accredited qualifications and professional CV-building certificates.
Join over 18 million learners to launch, switch or build upon your career, all at your own pace, across a wide range of topic areas.


