
Measurements of Growth and Development

China is an economic success because of sustained high rates of economic growth since the 1980s. Other countries have also recorded periods of rapid economic growth, eg Japan in the 1950s and 1960s, South Korea in the 1960s and 1970s and India in the 2000s, but none have sustained China’s high growth rates (about ten per cent per annum) over such a long period (30 years). The Chinese economy is much larger than it was in 1980 but does this mean that Chinese people are much richer? Has the standard of living of the average Chinese person increased at the same rate as the economy? In other words, is growth the same as development?
In answering these questions three concepts are important. First, how do we measure the size of the economy (the value of economic activity)? Second, how rich are people in the economy – what is the income of the average person? Third, what other non-monetary factors should be taken into consideration in assessing the development of a country – how do we measure the well-being or standard of living of the average person?
In principle, to measure the size of an economy all one has to do is add up the value of everything that is produced or add up everybody’s incomes – adjusting for transfers to and from other countries, total output should equal total income. In practice it is difficult, especially in poor countries where a large share of the population is engaged in subsistence agriculture or informal sector activities (certainly true of China in the 1980s). One problem is that not all incomes are observed (eg the earnings of a street trader) and some people will hide some of their income. Another is that some types of output are difficult to value, such as food grown by small farmers who consume it themselves.
National statistics offices compile data from many sources to estimate output and income. Important sources are surveys of producers, such as farms and firms, on output and surveys of households on incomes or spending (an indirect way to estimate incomes). This information and informed guesses are combined to estimate the size of the economy. The most common measures are Gross Domestic Product (GDP) and Gross National Product (GNP), the share of GDP owned by people in the country, also referred to as Gross National Income (GNI).
Once we have a measure of the size of the economy, for international comparison a common currency is required to adjust for price differences (a loaf of bread costs different amounts in different countries but is the same consumption item). The standard measure is Purchasing Power Parity US Dollars ($PPP) for a particular year to take account of differences in price levels relative to incomes. For example, 2005 $PPP would equate the price of the same basket of goods for households in two countries in 2005.
Using these measures, Table 8.A below shows how China’s GDP has grown from 1965 to 2011, compared to India (a comparable large poor country in the 1980s) and the UK (a typical rich country). The GDP data for 1965 and 1988 are in current US dollars ($current) not PPP so do not adjust for differences in prices and overstate the real difference in the size of the economies with the UK appearing much larger. The effect of using PPP is obvious in 1997: although the UK is larger using $current the Chinese economy is more than three times larger using $PPP. By 2011, the Chinese economy was almost five times the size of the UK and the Indian economy was almost twice the size. This reflects the rapid growth rates since 1980 shown in the lower panel: about 10% per annum for China, over 5% per annum for India but below 3% per annum for the UK.
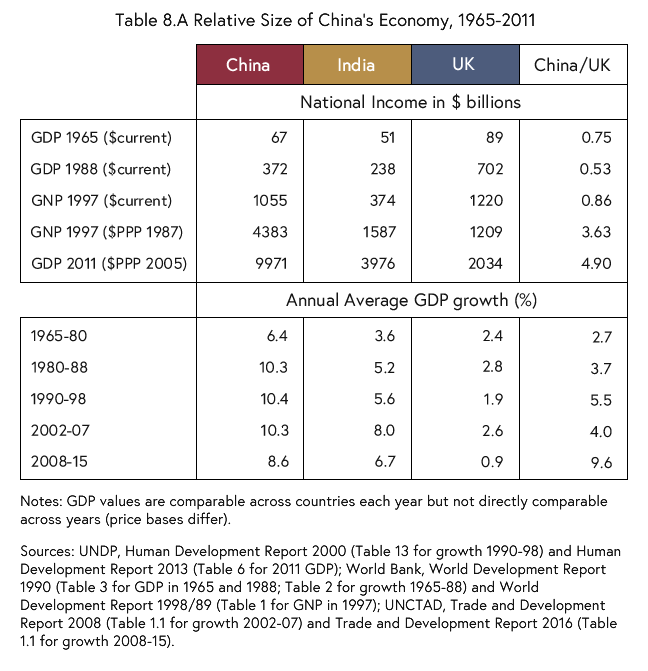 Table 8.A
China may now have a much larger economy than the UK, but what about the incomes of individuals? The average Chinese or Indian is much poorer than somebody in the UK because China and India have much larger populations. This is seen in Table 8.B below by dividing GDP by population to get an indication of income per capita (the average person) in each country. Even in PPP terms, per capita income in China is less than 20% of the level in the UK (India is even poorer) for most of the period since 1965, reaching just under 25% of the UK in 2011. In simple terms, the income of the average Chinese person in 2011 permits them to buy about a quarter of the goods that the average person in the UK can but. Nevertheless, average incomes in China have grown rapidly, and much faster than in India. The lower panel of Table 8.B illustrates how incomes in all countries have been rising so that China has only improved its rank slightly, the UK has more or less maintained its rank whilst India has fallen back in the ranking.
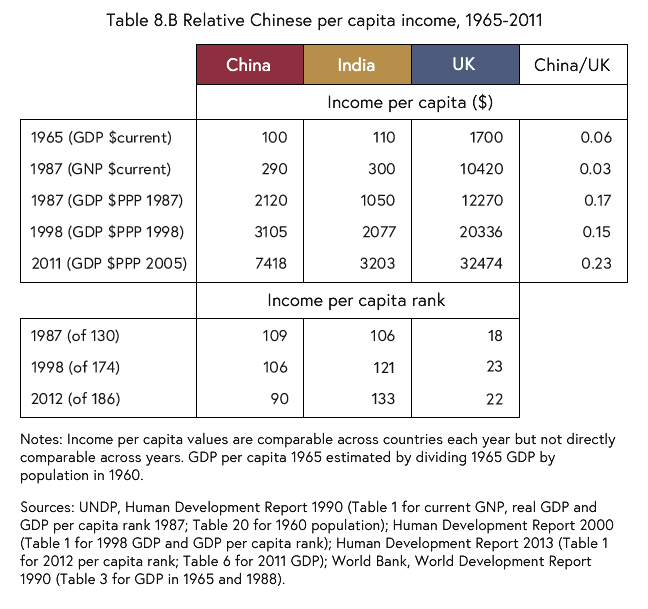 Table 8.B
The PPP income of the average person is only one indicator of the well-being of individuals in different countries. To get a broader measure of development we want to include elements of the standard of living. One commonly used measure is the Human Development Index (HDI) compiled by the United Nations Development Programme (UNDP). The HDI combines indicators of access to resources (based on PPP income per capita), educational attainment (literacy) and health status (longevity), each measured relative to the best performing country in the world. A country that had the maximum level of achievement on each of the three would score 1.0 (the highest country in 2012 was Norway with 0.955). The HDI for any country is how close it is to that maximum, so for example 0.5 is half way.
Table 8.C below shows China’s HDI compared to India and the UK in 1987, 1998 and 2012. China’s HDI has actually deteriorated slightly so it is falling behind relative to the global maximum (the UK has also deteriorated). The HDI in India is much lower but has increased. China’s relative position has deteriorated slightly (the sample has increased but China’s rank is now below the median shown in the lower panel of Table 8.C). India’s HDI rank has not improved. The UK has fallen back relative to other rich developed countries.
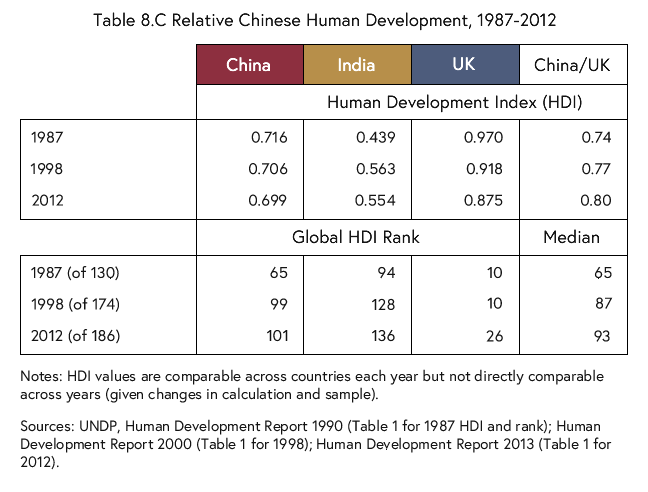 Table 8.C
Chinese economic growth and improvement in per capita income has not been matched by a similar improvement in human development. There are many other indicators of human welfare or development that could be considered. On some of these, such as reducing the number of poor or percentage of the population in poverty, China has done very well (India has not). On others, China has done badly. For example, income inequality has increased and pollution and environmental degradation have become very serious challenges.
The Chinese experience illustrates that achieving economic growth does not ensure the same level of improvement in the welfare of the population. Development Economics studies why this may be the case. Why is it so difficult for even rapidly growing economies to achieve significant improvements in the well-being of the population?
The question that Oliver concludes with is truly important. If economic growth is disconnected from improvements in well-being then what is its point? Please share in the comments below your answer to this question of why you think significant improvements in well-being are difficult to achieve and what we should do about it.
The Politics of Economics and the Economics of Politicians


The Politics of Economics and the Economics of Politicians
Reach your personal and professional goals
Unlock access to hundreds of expert online courses and degrees from top universities and educators to gain accredited qualifications and professional CV-building certificates.
Join over 18 million learners to launch, switch or build upon your career, all at your own pace, across a wide range of topic areas.


