
Presenting your findings visually

Charts, maps, and infographics help your audience understand complicated data, discover patterns, recognise trends, and tell a story. But it is important to ensure that the methods used do not distort your data. For example, is what looks like a big difference in your chart actually a big difference in your data? It is also good practice to keep your scale consistent across graphs so that readers can directly compare the results. It is usually also a good idea to keep your colour-coding consistent. If you assign, for example, the colour blue to one group and red to another group, stay consistent with these throughout your report.
Visual representations of qualitative data
We’ve already seen in Week 3 how tables and colour coding can be used to present qualitative data in easy to access formats.
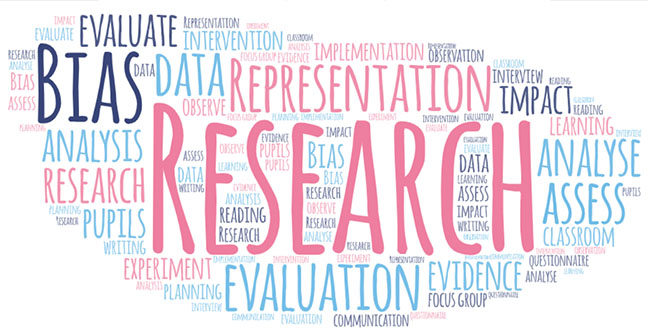
You might find it useful to represent some of your key themes on your poster using a word cloud such as the ones you can make for free at Wordle or Wordart.
You may find it useful to use icons, diagrams or timelines to represent your qualitative data. This article contains a number of possibilities.
Visual representations of quantitative data
The representation of quantitative data should allow for easy interpretation, this can be achieved through the use of tables or graphs. There are challenges when identifying the best way of representing data effectively. Few (2012) argues that one of the biggest issues is trying to represent data via the wrong medium (i.e. using a graph when a table would be more appropriate and vice versa).
Here are a few suggestions on when to use a table and when to use a graph. Note the word ‘values’ refers to numbers, percentages and so on.
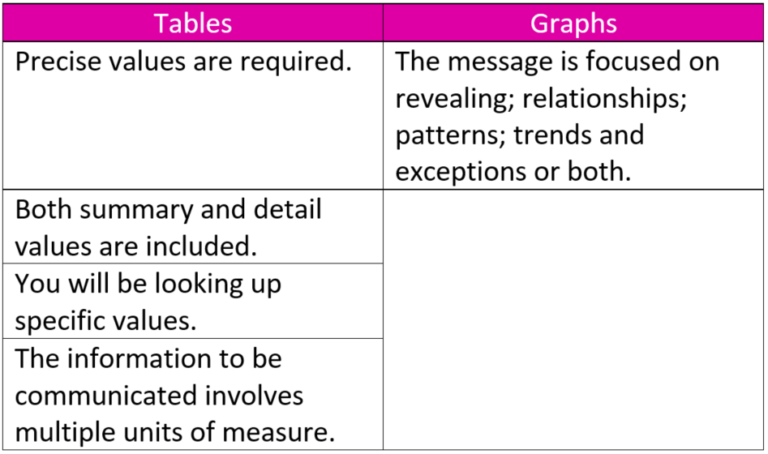
Few (2012) states that graphs reveal much more than a collection of numerical values. They are used as a way for us to quickly understand information and can be extremely effective if used correctly. Graphs allow large amounts of data to be understood quickly without confusing your audience with lots of numerical values. Your choice of graph is imperative to the readability of your data and may extend the audience’s ability to understand it.
If you want to begin by analysing trends in your data then placing it into a line, dual-axis, or column graph will be most useful.
If you’re seeking to understand the relationship between different data sets (baseline and end of project data for instance) then you should put the data into a scatter, bubble, or line graph.
It might seem obvious which chart to use but if it doesn’t then this guide will help you to decide (hint: it depends whether you want to compare values, show the parts of a whole, show the distribution of data…)
Whether to display your data in a table or a graph will depend on your audience and the data. Alverson and Yamamoto have investigated the preferences and accuracy of teachers, administrators, and parents when interpreting visual data for decision making. They acknowledge the challenge of determining how to present data depending upon the amount of data to present. They conclude that the amount of data, or data complexity, displayed in a graph contributes to the reader’s understanding. All participants, with the exception of parents, favoured having more complex graphs displayed on a single page (Alverson & Yamamoto 2014; Alverson & Yamamoto 2016).
How can we use Alverson and Yamamoto’s findings to help us decide how to display our data so that it supports our arguments and is accessible to our audience?
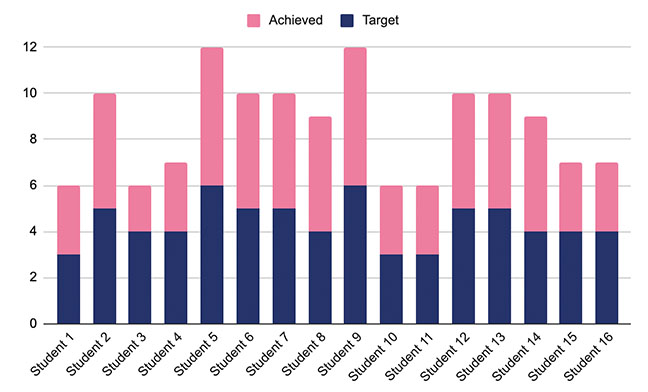
Examples of students’ results vs main target grade being presented in tabular vs graph form
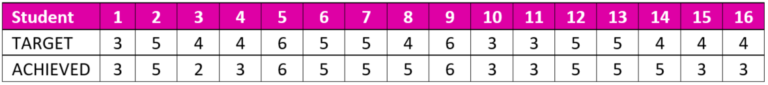
When comparing both of these presentations it could be argued that graphical format, in this instance, makes it easier to interpret the data. If the blue line is longer than the pink then the student did not meet their target grade, if the lines are equal, they met their target grade and if the pink line is longer the student exceeded their target.
As we have seen, using tables to represent data allows for a quick comparison of related values across data sets whereas graphs make it easier for the reader to identify trends. When choosing how you will represent your data, it is important to remember that as data sets become more complex, graphs are more accessible than tables (Spence and Lewandowsky 1991). In the debate between table vs. graph, consider how the data will be used, remember your target audience, and then decide on the best way to visualise the information.
References
Alverson, C. and Yamamoto, S. (2014). Talking with Teachers, Administrators, and Parents: Preferences for Visual Displays of Education Data. Journal of Education and Training Studies, 2(2).
Alverson, C. Y. and Yamamoto, S. H. (2016) ‘Educational Decision Making With Visual Data and Graphical Interpretation: Assessing the Effects of User Preference and Accuracy’, SAGE Open. doi: 10.1177/2158244016678290.
Few, S. (2012). Show me the numbers. 2nd ed. Burlingame, California: Analytics Press.
Spence, I. and Lewandowsky, S. (1991). Displaying proportions and percentages. Applied Cognitive Psychology, 5(1), pp.61-77.
Education Research that Matters: Doing Research in Your Learning Community


Education Research that Matters: Doing Research in Your Learning Community
Reach your personal and professional goals
Unlock access to hundreds of expert online courses and degrees from top universities and educators to gain accredited qualifications and professional CV-building certificates.
Join over 18 million learners to launch, switch or build upon your career, all at your own pace, across a wide range of topic areas.


