
Identifying system failure
Our multiple cause diagram is given above. It shows the obvious causes for people waiting in the corridor, namely too many people being admitted to the hospital but there being insufficient clinical beds for them to occupy. This is partly due to bed-blocking but also possibly to other causes.
This diagram shows chains of causes that could lead to solutions.
For example, it could be due to there being insufficient beds for the population being served.
The UK has 2.95 beds per thousand population, less than half as many as Japan (13.4), South Korea (9.56), Germany (8.27), Austria (7.65), Hungary (7.17), Czech Republic (6.84), Poland (6.55), France (6.37), Belgium (6.31), and Slovakia (6.06). So perhaps the problem is that the hospital simply does not have enough beds? Of course, significantly increasing the number of beds per capita could be very expensive and outside the control of the hospital manager. However, for some hospitals setting up non-clinical wards is seen as a cost-effective solution to the bed-blocking problem because the staff associated with non-clinical beds are much less expensive than trained nurses and doctors. This action is under the control of the manager of the hospital system.
For that part of the problem caused by bed-blocking, three causes are identified:
- there is no accommodation in residential homes,
- some people cannot go back to their home because there is no carer there to look after them, and
- sometimes people have to remain in hospital when the transport to move them fails to arrive.
The hospital manager has little control over the first two of these, since they are handled by welfare agencies. However, they may be able to address the transport problem.
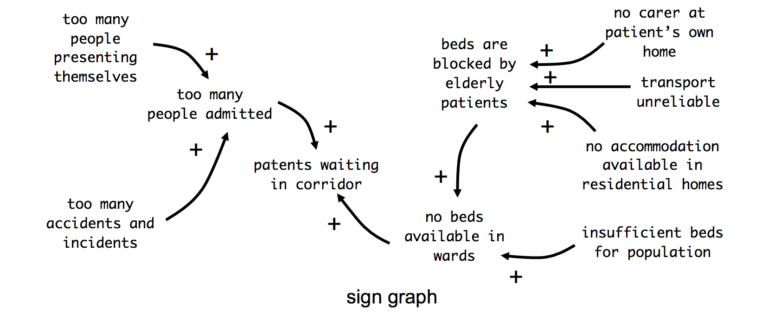
Our sign graph for the system is given above. This shows that many causes are responsible for the long waiting times in the corridor.
What do you think?
Were your multiple cause diagram and sign graph similar to ours? Do you think these diagrams help you to understand the systemic problem of bed blocking? Or is it all so obvious that systems thinking and diagrams add little or nothing? Give your views in the comments below.


Reach your personal and professional goals
Unlock access to hundreds of expert online courses and degrees from top universities and educators to gain accredited qualifications and professional CV-building certificates.
Join over 18 million learners to launch, switch or build upon your career, all at your own pace, across a wide range of topic areas.


