
Above-ground biomass
Previously, you have reviewed how land interacts with the climate and vice versa. In the coming articles, more scientific depth on terrestrial essential climate variables will be provided. In this article, you will learn about above-ground biomass and why it is an essential climate variable used to characterise the climate-land nexus. From the biomass project of ESA’s Climate Change Initiative you can learn how above-ground biomass is generated from the satellite observations.
Definition: above-ground biomass is the mass of living and/or dead organic matter in terrestrial vegetation. It has a unit of mass per unit area, g/m2.
Biomass serves as both a sink and a source of CO2 — i.e., growth versus deforestation. As a result, biomass maps can help scientists determine the carbon sink and source and estimate its variation over time (Le Toan et al., 2011). Above-ground biomass is regarded as one of the most critical variables for monitoring terrestrial ecosystems. It enables scientists and, particularly climate change experts, to monitor ecosystem carbon dynamics at different scales (IPCC, 2019).
Satellite observations have proven instrumental to map biomass changes on a global scale (Santoro, 2018). For instance, satellite-derived vegetation indices or light use efficiency models are broadly applied to predict gross primary production as a proxy of carbon biomass (Xiao et al., 2019). However, each approach has its strength and weakness. For instance, vegetation indices become saturated by dense vegetation; using physical models as one of the most accurate approaches also requires ancillary data.
The Climate Change Initiative project Biomass generated above-ground biomass products at the global scale for four epochs: the Mid 1990s, 2010, 2017, and 2018. With a resolution of 100 m, these help scientists quantify changes in biomass. Different earth observation techniques are able to retrieve biomass successfully, including synthetic aperture radar (SAR), optical satellite data, and light detection and ranging (LiDAR) data. The CCI biomass project applies data from several Earth observation missions to retrieve biomass, including optical data (e.g., Sentinel-2A/B), SAR C-band (Envisat ASAR for 2010 and Sentinel-1 for 2017-2018), L-band (ALOS-1 PALSAR-1 for 2010 and ALOS-2 PALSAR-2 for 2017-2018), Spaceborne LiDAR (e.g., Global Ecosystem Dynamics Investigation LiDAR). The CCI biomass project also retrieves biomass using the technique proposed by Avitabile et al. (2016), fusing maps according to the level of agreement with reference biomass measurements. It should be highlighted that the products generated by the CCI biomass project comprise estimation of forest above-ground biomass. Land cover information is applied to exclude specific classes. In addition, the products have been validated using forest inventory, GlobBiomass reference database, and plot data obtained from various research networks.
Furthermore, ESA’s Biomass Earth Explorer satellite, scheduled to launch in 2023, will concentrate on woodland canopies to conduct a global forest survey and observe how biomass evolves throughout a five-year mission.
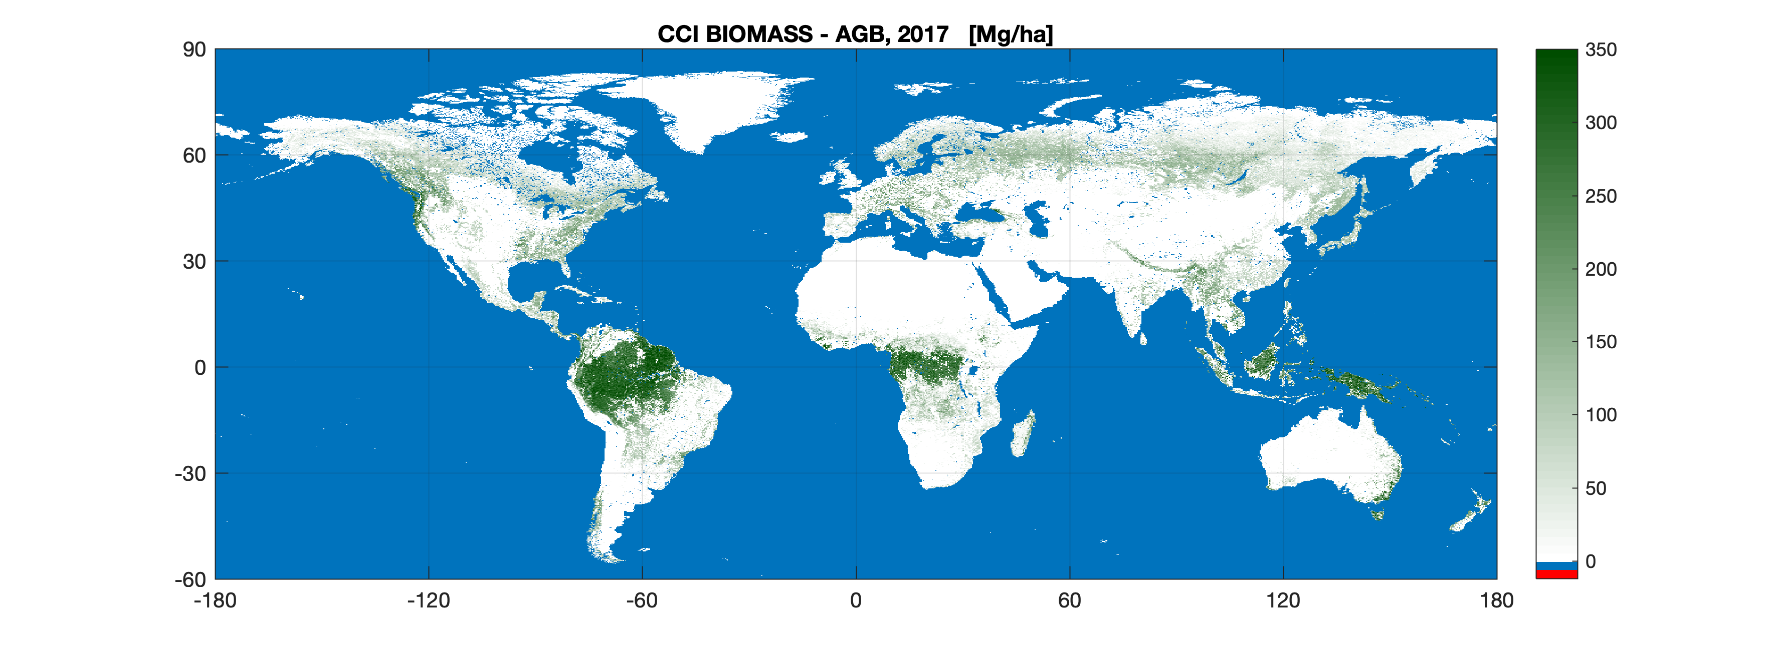 Figure 1: Biomass map aims at quantifying change in carbon stored. From Santoro, (2018) (Click to expand)
Up next
In the next article, you will learn about another essential climate variable: land cover.
Understanding Climate Change using Satellite Data


Understanding Climate Change using Satellite Data
Reach your personal and professional goals
Unlock access to hundreds of expert online courses and degrees from top universities and educators to gain accredited qualifications and professional CV-building certificates.
Join over 18 million learners to launch, switch or build upon your career, all at your own pace, across a wide range of topic areas.


