
Gendering of the Workplace: Statistics and Evidence

Below are some examples that demonstrate the gendering of roles. Firstly, we explore the extent of labour force participation, which sets the scene in terms of the proportions of men and women in the workplace, from which we might infer a work-home divide with women taking on more household roles (although unemployment will also be a factor). We also look at the gender split between full-time and part-time work. We then look at occupational differences, specifically the gendering of science-based roles as being more masculine (and thus likely to be disproportionately occupied by men), and caring roles more feminine (and thus likely to be disproportionately occupied by women). Consider how the representation of women and men in particular roles might influence people’s perception of them and how accessible certain occupations may feel to a member of the minority sex in that occupation.
Work and Home
Women still undertake the majority of care work (including household chores), but this is now often undertaken alongside paid-work, as labour force participation rates for women have increased to levels much closer to men. However, this is not a consistent picture worldwide, as the following map [1] demonstrates.
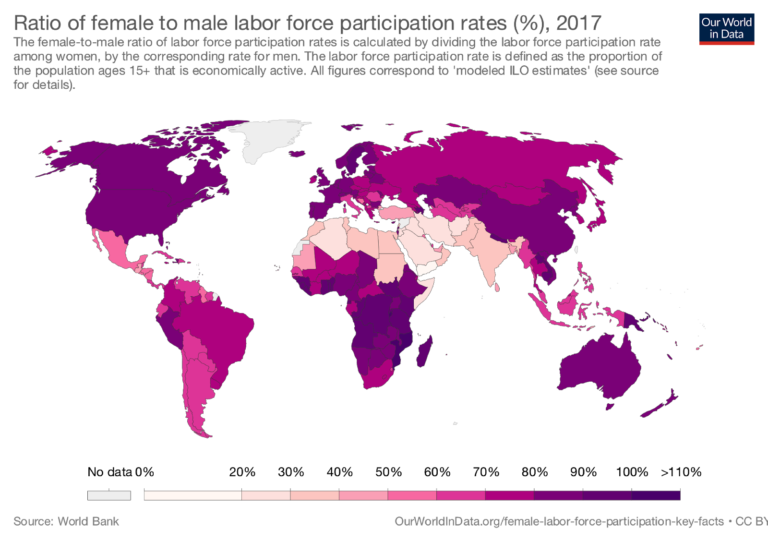 Click to enlarge image Source: World Bank.
Overall the map demonstrates that men are usually more frequently employed than women. In many countries (both high and low income) the participation rates are comparatively close, but in others there is a significant gap. The labour force participation rates have changed over time, as the following two graphs demonstrate [1].
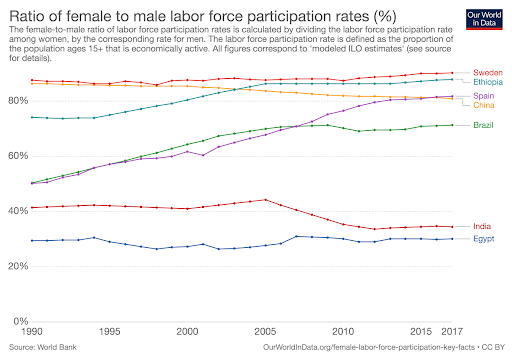
This data reflects some of the worldwide trends that demonstrate labour force participation is growing, declining or broadly static depending on the country, and that the rates of labour force participation range considerably from the low to comparatively high. However, in the main participation rates have improved, as demonstrated below [1].

Unpaid work
Part of the reason for the lower representation of women in the workforce is that they are disproportionately likely to take on roles that are not measured as economic activities, such as unpaid care work and managing the home. The following graph shows how some countries compare when considering the gender ratio of unpaid work.
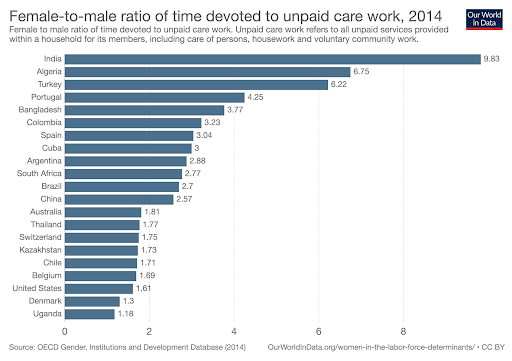
The Office for National Statistics in the UK have calculated that when it comes to unpaid domestic chores at home, women do 60% more than men [2]. But the type of activity also matters, with men more likely to take on transportation, such as driving children to activities, but a lot less likely to do the cooking, childcare and housework. This suggests that even within the home, there is a gendering of the types of unpaid work undertaken.
Part-time and full-time work
Women are disproportionately likely to work part-time compared to men. This offers them flexibility to take on caring roles, which they are more likely to undertake than men, but it is also associated with lower rates of pay and less preferential working conditions. The graph below sets out some of the international differences between rates of part-time work between men and women.
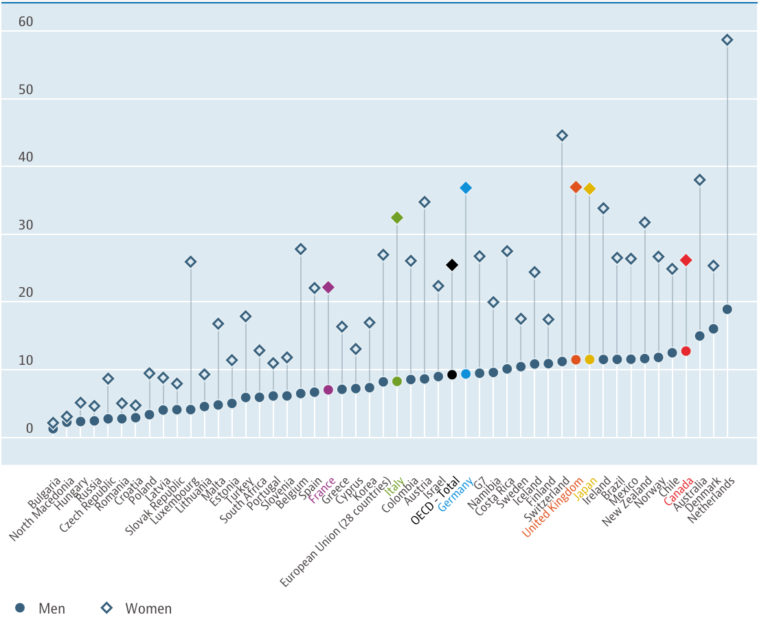
Source: Labour Market Statistics: Full-time part-time employment; OECD (2019), Part-time employment rate (indicator). doi: 10.1787/f2ad596c-en
Participation rates in the workforce will be affected by factors such as: the time taken to complete domestic household chores and accessibility of labour-saving domestic devices, flexibility in working hours, contributions made by men in completing chores, maternal health and fertility rates, policies and provision supporting childcare, formal restrictions in place on women working, and cultural attitudes [3] .
Occupations
We can also see occupational segregation, whereby men and women are more likely to be employed in particular occupations. This can have knock on effects where there are benefits and opportunities attached to particular occupations.
Women in science?
Men are far more likely to be employed in science-based subjects than women. According to UNESCO, women scientists comprise less that 30% of the scientists globally. In the US (2011) [4] women comprised 26% of computer and mathematical-based occupations. In the UK (2017) [5] women comprised 23% of science, engineering, technology and mathematics-based occupations (excluding health). Eurostat suggests a more positive picture for women in science in Europe. Overall, however, men are disproportionately represented in science-based fields.
Women in caring roles?
Women are far more likely to be based in caring roles. Some national-level statistics are given below.
| Where? | Proportion of women in role |
| Australia, 2018 [6] | 88% of nurses are women |
| China, 2016 [7] | 98% of nurses are women |
| UK, 2018 [8] | 89% of nurses and health visitors are women |
| US, 2011 [9] | 92% of registered nurses are women |
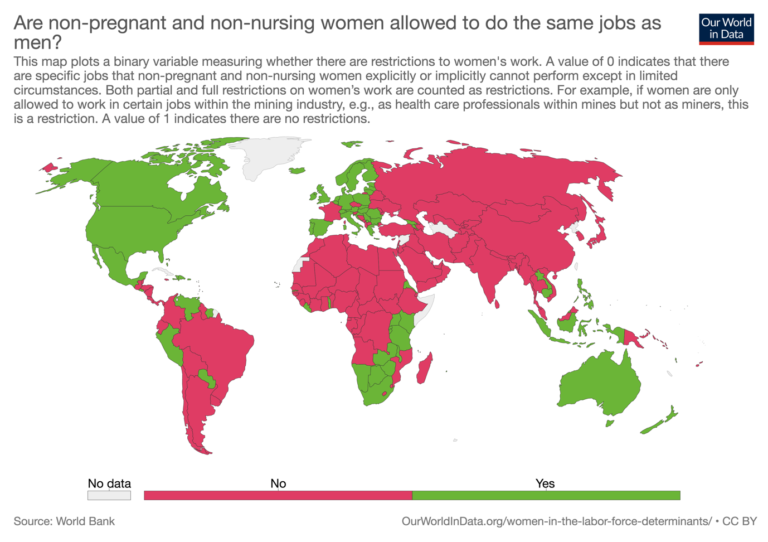
In some countries women are not always allowed to undertake the same roles as men, or some restrictions apply, as the map below demonstrates [10]:
As the following two charts demonstrate, women are more likely than men to be employed in services, and men are more likely than women to be employed in industry [11].
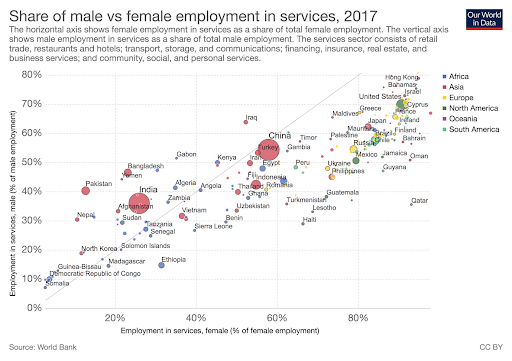
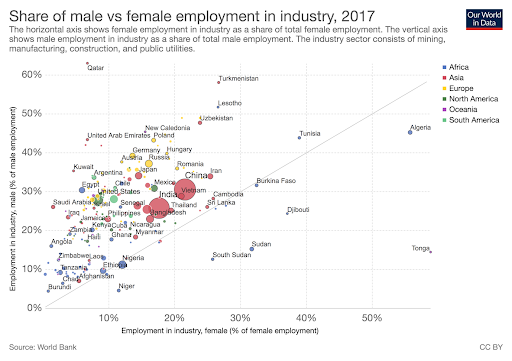
These figures reflect the tendency for occupational segregation, as men and women are more likely to be found in particular types of work or industry. The gendering of types of work, particularly where roles are almost exclusively male or female, can be linked with the value placed on types of work – a theme we will return to when we look at the gender pay gap.
Read more:
Unpaid work (UK):
The Office for National Statistics published an article claiming Women shoulder the responsibility of ‘unpaid work’.
The House of Commons Briefing Paper entitled Women and the Economy looks at women’s participation in the UK labour market and in business
Women in Science (Global):
This UNESCO paper, Women in Science, presents data on the gender gap in science.
The Executive Summary of Science, Technology and Gender: An International Report, from UNESCO, presents data relating to gender disparity in science and technology.
Elsevier’s Gender in the Global Research Landscape presents an anlysis of research performance through a gender lens across 20 years, 12 geographies, and 27 subject areas.
Women in work
Our World in Data has published an overview of data related to the Female Labor Supply
References
- World Development Indicators (WDI) Data Catalog [Internet]. Datacatalog.worldbank.org. 2019 [cited 28 June 2019]. Available from: https://datacatalog.worldbank.org/dataset/world-development-indicators
- Women shoulder the responsibility of ‘unpaid work’ – Office for National Statistics [Internet]. Ons.gov.uk. 2019 [cited 28 June 2019]. Available from: https://www.ons.gov.uk/employmentandlabourmarket/peopleinwork/earningsandworkinghours/articles/womenshouldertheresponsibilityofunpaidwork/2016-11-10
- Ortiz-Ospina E, Tzvetkova S, Roser M. Female Labor Supply [Internet]. Our World in Data. 2019 [cited 28 June 2019]. Available from: https://ourworldindata.org/female-labor-supply
- Dept of Labor, Women’s Bureau, Data and Stats – Employment and Earnings by Occupation [Internet]. Dol.gov. 2019 [cited 28 June 2019]. Available from: https://www.dol.gov/wb/occupations_interactive.htm
- Women in STEM workforce 2017 – Welcome to the WISE Campaign [Internet]. Welcome to the WISE Campaign. 2019 [cited 28 June 2019]. Available from: https://www.wisecampaign.org.uk/statistics/women-in-stem-workforce-2017/
- Nursing and Midwifery Board of Australia – Statistics [Internet]. Nursingmidwiferyboard.gov.au. 2019 [cited 28 June 2019]. Available from: https://www.nursingmidwiferyboard.gov.au/about/statistics.aspx
- Yang J, Hao D. Dilemmas for nurses in China. The Lancet. 2018;392(10141):30. Available from https://doi.org/10.1016/S0140-6736(18)31185-1
- Narrowing of NHS gender divide but men still the majority in senior roles – NHS Digital [Internet]. NHS Digital. 2019 [cited 28 June 2019]. Available from: https://digital.nhs.uk/news-and-events/latest-news/narrowing-of-nhs-gender-divide-but-men-still-the-majority-in-senior-roles
- Are non-pregnant and non-nursing women allowed to do the same jobs as men? [Internet]. Our World in Data. 2019 [cited 28 June 2019]. Available from: https://ourworldindata.org/grapher/are-non-pregnant-and-non-nursing-women-allowed-to-do-the-same-jobs-as-men
- Ortiz-Ospina E, Tzvetkova S, Roser M. Female Labor Supply [Internet]. Our World in Data. 2019 [cited 28 June 2019]. Available from: https://ourworldindata.org/female-labor-supply


Reach your personal and professional goals
Unlock access to hundreds of expert online courses and degrees from top universities and educators to gain accredited qualifications and professional CV-building certificates.
Join over 18 million learners to launch, switch or build upon your career, all at your own pace, across a wide range of topic areas.


