
What can data tell us about why children under five die?

Knowing how many children die and the main causes of death can help us to identify priorities for improving child survival. Having data on these deaths enables us to determine risks at different ages and track progress or survival trends. While it is especially critical to have this information in order to reach the poorest in society, availability of data for these groups is lower despite their risk of death being higher1.
What do we mean by children?
Global child mortality targets and data have focused on children under the age of 5 years, as this is the period in which most deaths occur. Increasing policy attention for adolescents is now resulting in increasing data, as we saw in Week 1. However, there are very limited data for child deaths occurring between the ages of 5 and 10 years.
At the start of the Millennium Development Goal (MDG) era, there was talk of assessing child deaths without including infants (<1 year of age). The data has since shown that it is more important to consider the neonatal period in isolation since the trends and causes of deaths, and therefore interventions, differ more between the first month and after the first month.
Where do the numbers for mortality rates come from?
Of the 195 United Nations (UN) member states, more than 100 have routine collections of death certificate data, including those for children, through Civil Registration and Vital Statistics (CRVS) systems. However, not even 70 of those countries have data strong enough to be used for counting child deaths and tracking the causes of death. Countries with good CRVS are mostly high- and middle-income settings that account for approximately 5% of child deaths globally.
In order to count child deaths for most of the world we therefore rely on household surveys. This involves a team of interviewers visiting houses and asking the family questions about births, health care and deaths in the last five years. Two surveys that are routinely used in many low- and middle-income countries are the Demographic Health Surveys (DHS) and UNICEF’s Multiple Indicator Cluster Survey (MICS). As these surveys are only conducted every 5 years and on a sample of people in each country they can only give provide estimates, rather than true counts, of the numbers of deaths. For around 25 countries with recent or ongoing instability there are no nationally representative surveys. Some countries lack reliable data for as much as the last decade, making estimates for those countries even more uncertain.
The UN produces annual estimates for neonatal and child mortality for each country. The process for producing mortality rates in countries where the deaths are based on sample data is overseen by an advisory committee called the UN Interagency Group on Child Mortality estimation. The input data and estimates are discussed with each country, aiming to identify any other data and encourage data improvements, such as more focus on coverage and quality of CVRS.
The Institute for Health Metrics and Evaluation (IHME) also produces estimates of neonatal and child mortality. Although the UN and IHME are using similar data inputs and may have different ways of estimating mortality, most of the estimates are similar at global and regional level. However, in a few countries the estimates are very different2.
Where do the numbers for cause of death come from?
The number of countries with high-quality vital registration data has increased from 45 in 2005 to 66 in 2015. For the remaining countries, the causes of deaths are currently estimated using multi-cause statistical models. Various cause-of-death data, including studies using verbal autopsy methods in high mortality settings, are included as inputs into the models. These models are then used to estimate the cause-of-death distribution in countries based on their most recent national predictor data, e.g. intervention coverage, female literacy, and so on3,4.
The numbers for neonatal and child cause of death used in this course come from WHO estimates, using methods developed and applied by the former Child Health Epidemiology Resource Group (CHERG): now the Maternal and Child Epidemiology Estimation (MCEE) group. This group was formed more than 10 years ago in order to advise WHO and other international organisations on the most appropriate methods for their country-level child health epidemiological estimates. Up until then, estimates for the number of deaths from different causes were generally produced by disease-specific or intervention-specific working groups, leading to a global total of more than all the child deaths in the world at the time.
IHME now also produces child cause of death estimates 3 using a different modelling approach from CHERG/MCEE.Results from IHME are generally similar to those of the WHO. Clever modelling, however, is not a perfect solution: improved data for numbers and causes of deaths and counting births through CRVS is crucial.
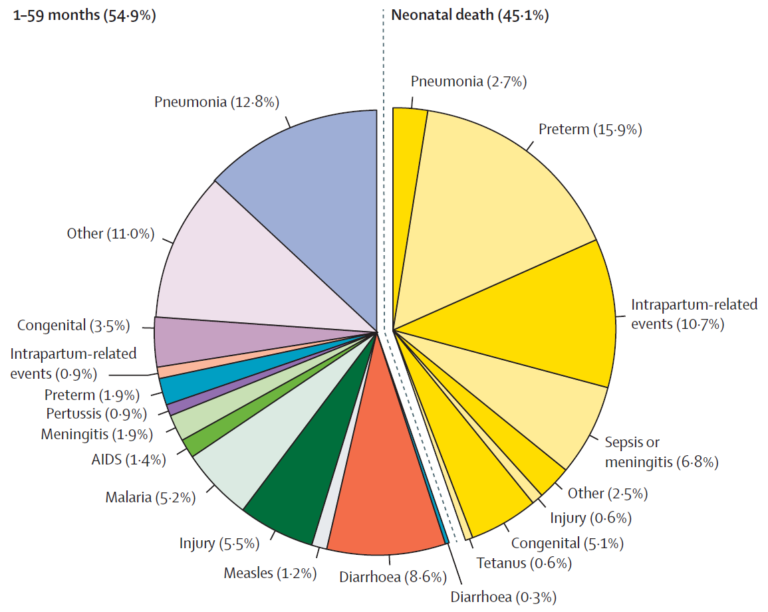
Figure 1: Estimated causes of child deaths for 195 countries. (Liu et al., 2016) 4
So how many children die and what do they die from?
Globally, around an estimated 6 million children died in their first 5 years of life in 2015, as seen in Figure 1. 4 This demonstrates several important points that we’ll consider in more detail this week:
- Deaths in the first month of life (the neonatal period) are shown in yellow and account for almost half (45%) of deaths. Of the neonatal deaths, preterm birth complications (35%) and intrapartum-related events (24%) account for the greatest number of deaths.
- Over 40% of deaths in children under 5 years were attributed to infectious causes, with pneumonia, diarrhoea and sepsis/meningitis/other severe infections being the leading causes.
Figure 2 shows the estimated numbers of children dying of different causes in the neonatal period and up to 5 years of age.
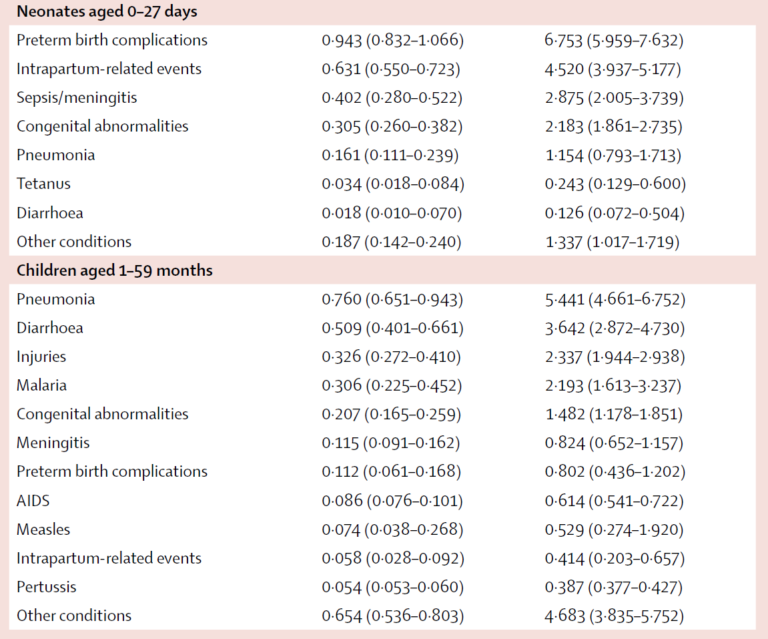
Figure 2. Estimated number of under five deaths by cause 4.
How have causes of child deaths changed since 2000?
Under 5 mortality has halved in the last 15 years, with 9 of the 10 fastest reducing causes being infectious conditions. The largest absolute reductions were from pneumonia, diarrhoea and measles deaths, which together accounted for almost half of the gain in child survival. Why these trends exist for some causes of child death but not others is explored in greater detail in the next steps.
Improving the Health of Women, Children and Adolescents: from Evidence to Action


Improving the Health of Women, Children and Adolescents: from Evidence to Action
Reach your personal and professional goals
Unlock access to hundreds of expert online courses and degrees from top universities and educators to gain accredited qualifications and professional CV-building certificates.
Join over 18 million learners to launch, switch or build upon your career, all at your own pace, across a wide range of topic areas.


