
アウトブレイクシナリオに関する練習問題

もう一つの短い練習問題です。アウトブレイクシナリオに登場する、ダンズウッド病院のメロペネムまたは第3世代セファロスポリンの使用に関するデータを見てみましょう。
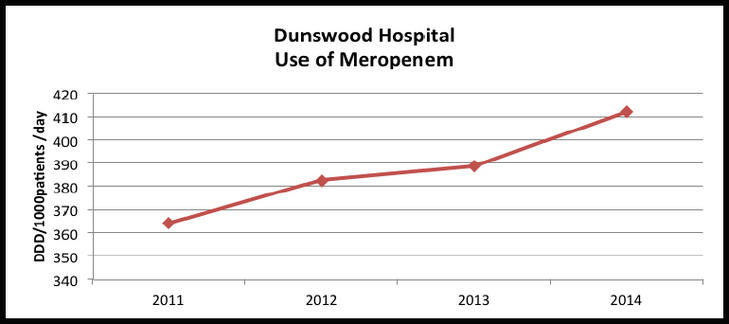
この表は、ダンズウッド病院の架空のデータセットを示すために作成されました。 タイトルは、ダンズウッド病院の「メロペネム使用」です。 Y軸はDDD / 患者1000人 / 日を、X軸は2011、2012、2013、2014年を表わします。グラフのプロットは、2011年は365 DDD / 患者1000人 / 日、2012年は380強、2013年は390、2014年は410強とメロペネムの使用の増加傾向を示しています。
これは何を示していますか?
これは現在のアウトブレイクに寄与していますか?
このデータを使って何をしますか?
コメント欄にあなたの意見を投稿してください
抗菌薬使用に関するデータをDDDに変換する計算用に設計された、無料のAntimicrobial Consumption Toolがあります。抗生物質使用に関する独自のデータをお持ちの場合は、このアプリケーションをお試しください (Windows版のみ)。
WHOのIntroduction to Drug Utilization Researchは、詳しい解説を読むことのできる優れたリソースです。


Reach your personal and professional goals
Unlock access to hundreds of expert online courses and degrees from top universities and educators to gain accredited qualifications and professional CV-building certificates.
Join over 18 million learners to launch, switch or build upon your career, all at your own pace, across a wide range of topic areas.


