
Charts
In the previous step, you learned how to draw accurate reports that you can use to gain insights into how your business is doing.
You can use these reports as is or customise them for your needs. You can also use the Report Wizard to create custom reports. Another way to view your analytical data is by compiling charts.
Charts are graphical representations of data from different views of an entity. When a view is updated, so is the chart.
In Dynamics 365 there are several different types of charts available. You can use the out of the box charts or you can customise your own. Once the chart is created, it can be used from within views or added to Dashboards.
To locate chart definitions, within the solution you can find them under the entity that is the target of the chart.
System Charts
System charts are created by users with a system administrator or system customiser security role. These charts are visible to all users in the organisation. If you customise a solution or the system, you have the chart option under each entity. These charts use system or personal views to populate the chart.
The types of system chart you can create in the system charts are column, stacked column, 100% stacked column, bar, stacked bar, 100% stacked bar, area, stacked area, 100% stacked area, line, pie, funnel, tag and doughnut.
You would need to specify the fields that you want to display on the Horizontal (Category) Axis Labels and the Legend Entries (Series). The Legend Entries (Series) axis displays data that is only a numeric value.
You can choose Avg, CountAll, Count Non-empty, Max, Min, or Sum. If you choose a non-numeric field for the series axis, you can only choose CountAll or Count Non-empty. Record
The Horizontal (Category) Axis Labels displays either numeric or non-numeric values. You can have up to two categories listed.
Charts can be exported and imported into other solutions. You can also customise charts by exporting the chart to an XML file and making the appropriate modification needed in XML.
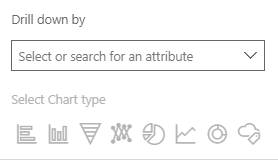
Types of Charts
This is the menu to choose which type of chart you want to create. You can select it from the top menus or choose it under the picture of the chart.
Column Chart
Stacked Column Chart
100% Stacked Column Chart
Bar Chart
Stacked Bar Chart
100% Stacked Bar Chart
Area Chart
Stacked Area Chart
100% Stacked Area Chart
Pie Chart
Line Chart
Funnel Chart
Tag Chart
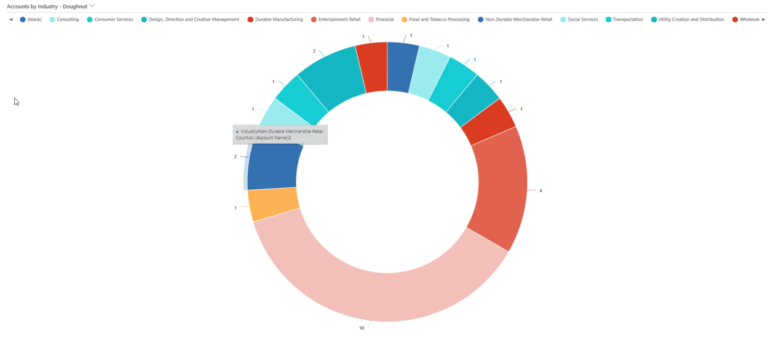
Doughnut Chart
*
Rules
Note: Personal charts are very similar, except Tag and Doughnut charts are not available in personal charts.
Rules can be created to only show the top or bottom few records in the chart. You can select this from both the menus and while building the chart itself.
Viewing Charts
When displaying the chart next to your view, they are collapsed by default, but when you select Show Charts, the chart will appear on the left side of the view.
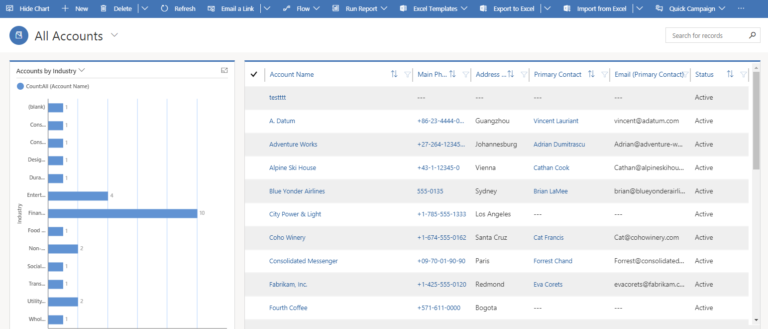
Once it displays, you can select a different view and the chart will refresh with the data from the new view.
Drilling Down
Drilling down means going into the chart to see only specific data. If you are drilling down through the chart, you will be asked for certain questions regarding which area you will want to drill into. To drill down into the data further, simply click on the chart itself and you will be given the ability to make your data selections.
Personal Charts
Personal charts are available via the classic menus and are expected to be available with the interactive menus in the next release. Personal charts are very similar to system charts. Personal charts are associated with the user who created them but can be shared out with other users.
A user can export a personal chart definition and share it with an administrator who can then import it and configure it as a system chart and make it available to all users.
In the following step, we explore goals and take part in a discussion. Click on Mark as complete when you are ready to move on.
Dynamics 365: Customer Engagement for Sales


Dynamics 365: Customer Engagement for Sales
Reach your personal and professional goals
Unlock access to hundreds of expert online courses and degrees from top universities and educators to gain accredited qualifications and professional CV-building certificates.
Join over 18 million learners to launch, switch or build upon your career, all at your own pace, across a wide range of topic areas.


