Skip main navigation

New offer! Get 30% off one whole year of Unlimited learning. Subscribe for just £249.99 £174.99. New subscribers only. T&Cs apply

Find out more

Where do graphs fit into analysis?

In this article, the value of graphs in data analysis is discussed.
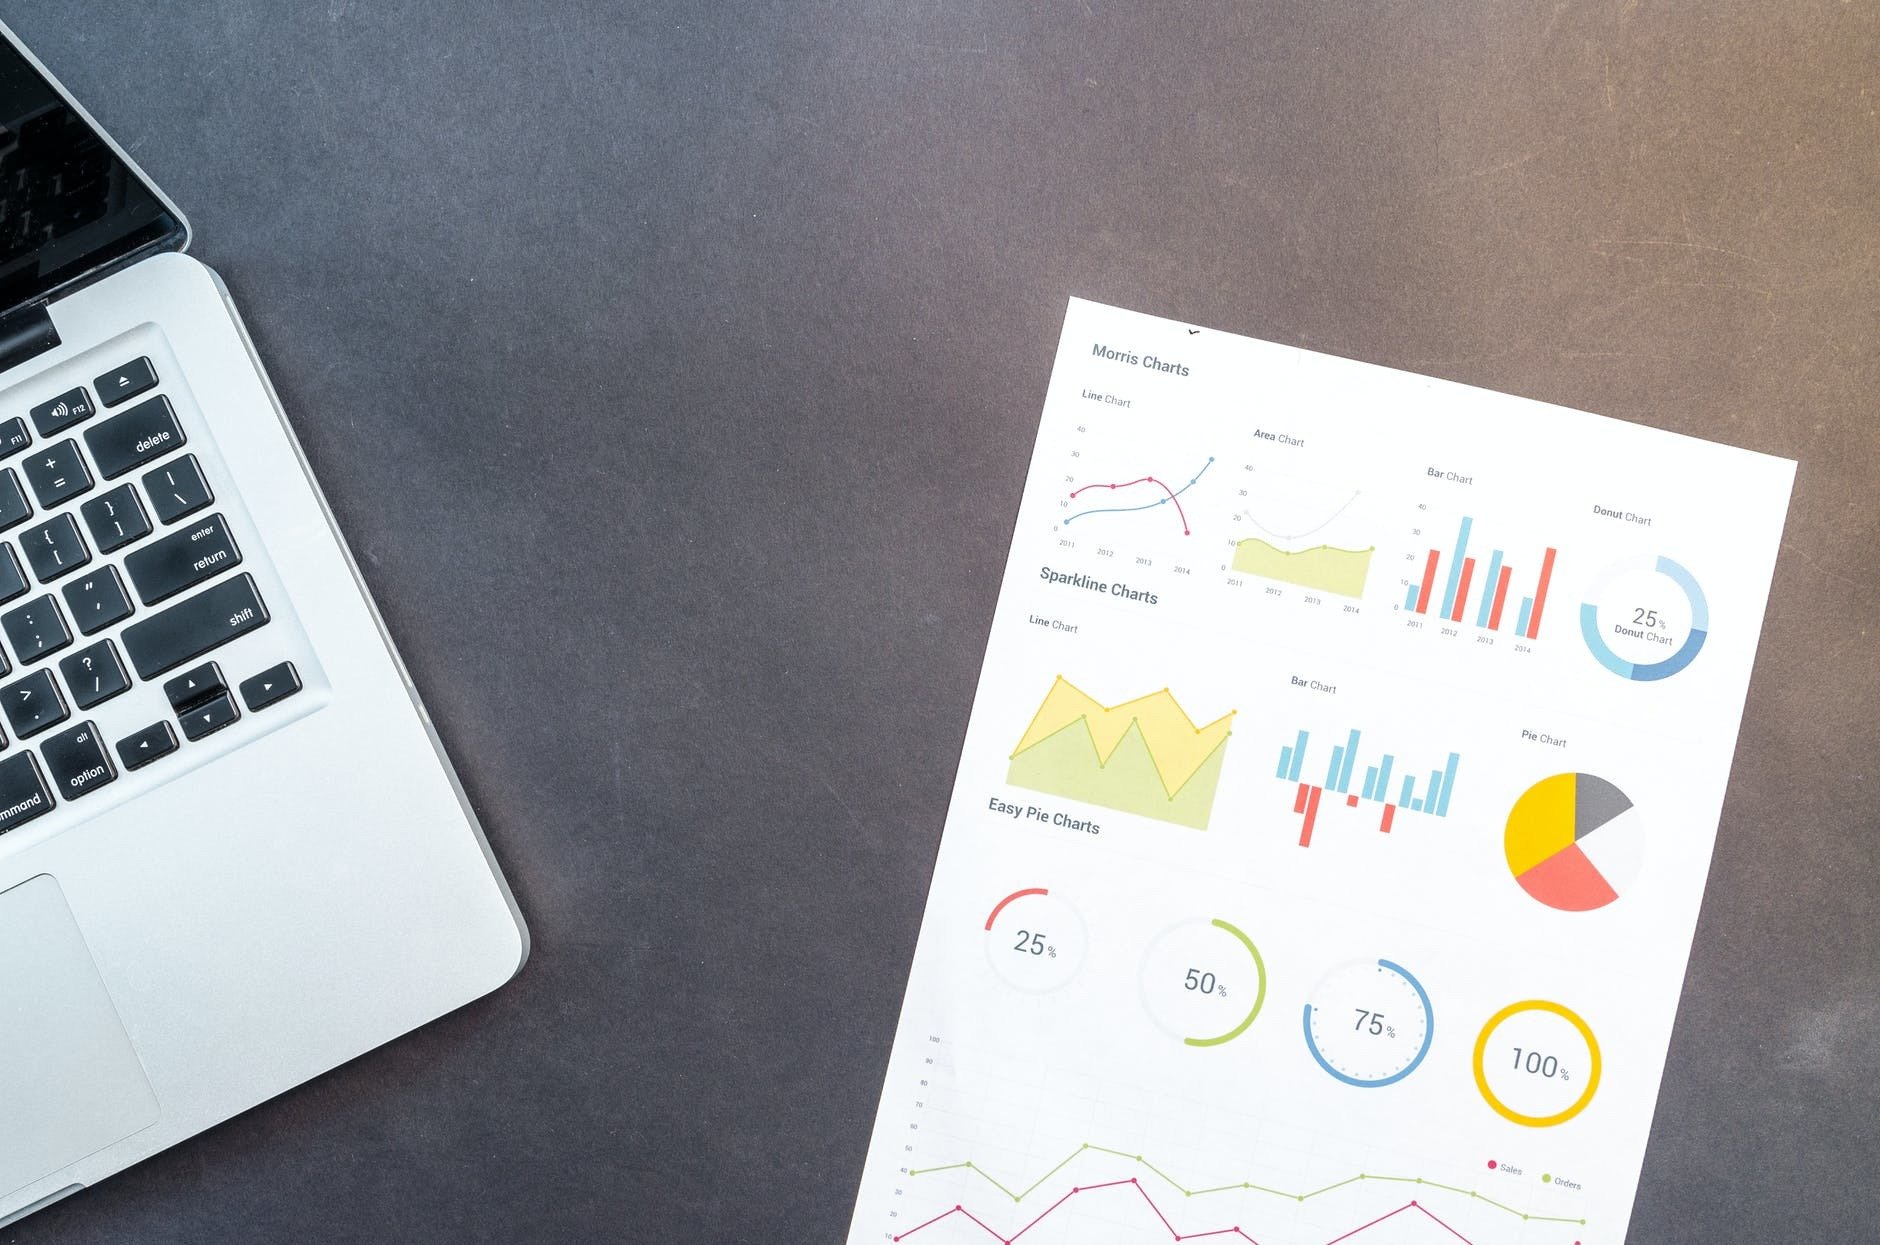
graphs on printed paper next to laptop

Graphs? Why Graphs?

Do you think of graphs when you think of data analysis? Maybe you do, but if you don’t then it’s time to start.

Often people consider effective data analytics to be complicated, but that is definitely not always the case. The goal of data analytics in business is to learn about the characteristics of the data to make decisions. The better we understand it, the better we achieve that goal. The goal isn’t to make sure that no one understands our analysis. Visualising data is often the most effective way of describing it for human beings, because sight is such an important part of how we interact with the world. A good graph can make insights obvious and doesn’t require the viewer to decipher a complicated calculation. Even if it isn’t always the final result of an analysis, it often provides an important starting point.

In the next activity, Adrian will talk through several useful graphical techniques. He will discuss what type of data is appropriate for each technique and how to interpret the visualisations with examples. You will learn about pie charts, bar charts, histograms, line plots, and scatter plots.

© Bond University
This article is from the free online

Data Analytics for Decision Making: An Introduction to Using Excel

Created by
FutureLearn - Learning For Life

Reach your personal and professional goals

Unlock access to hundreds of expert online courses and degrees from top universities and educators to gain accredited qualifications and professional CV-building certificates.

Join over 18 million learners to launch, switch or build upon your career, all at your own pace, across a wide range of topic areas.

Start Learning now