
Using predictive analytics
Predictive analytics is slowly catching up in the data analytics space. Zion Market Research recently released a report concluding that the global predictive analytics market is expected to reach USD 10.95 billion by 2022. This means it is anticipated to have a compound annual growth rate (CAGR) of 21% between 2016 and 2022. [1]
This says a lot about the important role played by predictive analytics in organisations. In the previous step you watched a video that defined models that could be designed to predict future outcomes in your business. Every organisation can choose how they want to use predictive analytics – they might choose multifaceted ways or a way that is specific for a particular use case.
To illustrate these diverse opportunities, here are some common scenarios and use cases for predictive outcomes.
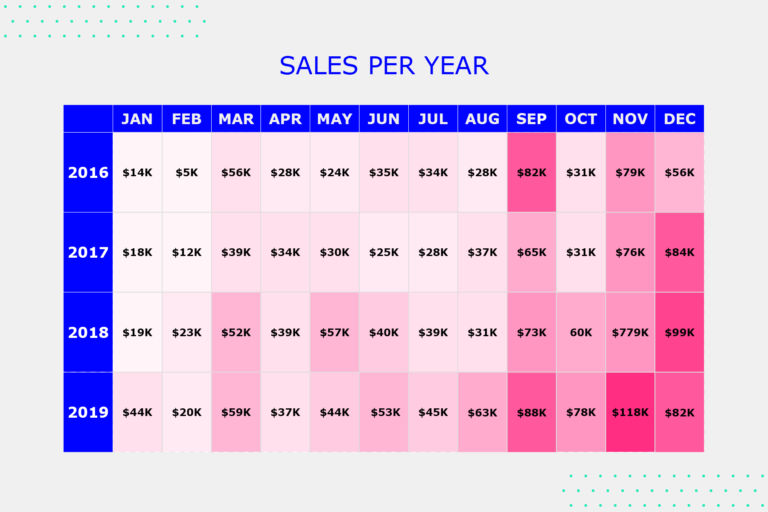
Seasonality: Predicting seasonal trends from historical data
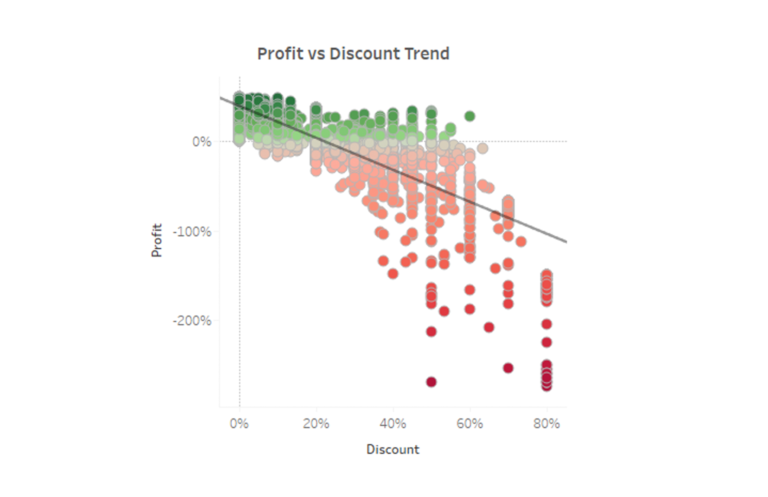
What-if analysis using a regression model: Predict changes in profit ratio relative to discounts
Classification: Life expectancy of women globally
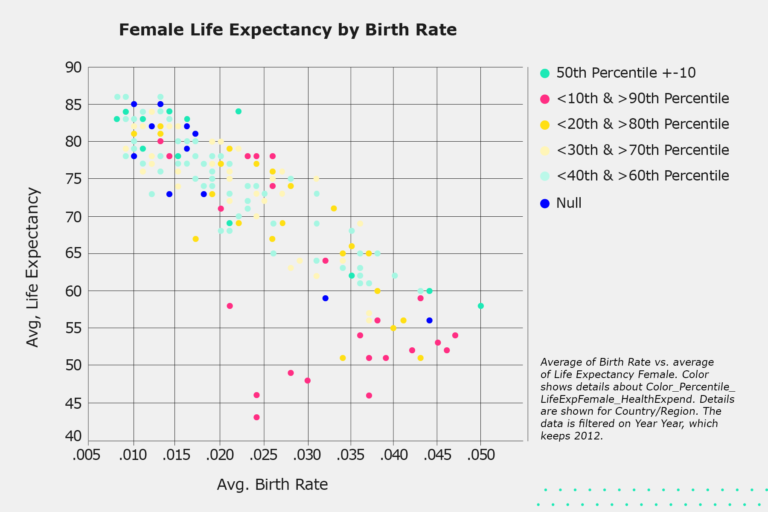
Note: The example above shows the trends in life expectancy of women according to birth rate, and classified life expectancy according to healthcare spend per capita. The example above shows the trends in life expectancy of women according to birth rate, and classified life expectancy according to healthcare spend per capita. The functionality for this model is due in Tableau 2020.3 later this year. [2]
Examples
The Oil and Gas Company
Consider the diagnostic example from part one of this course, in which the Oil and Gas Company discovered why its business-to-business [B2B] profit was lagging behind oil price trends. With the information and insights they uncovered, the company could now employ predictive analytics to anticipate profit guidance based on historical trends, using data from:
-
oil price movements
-
B2B contract arrangements
-
supply and demand trends.
The next figure shows seasonal comparisons between 2 years of historical data. It would help us to investigate seasonality trends that could be considered in a predictive model.
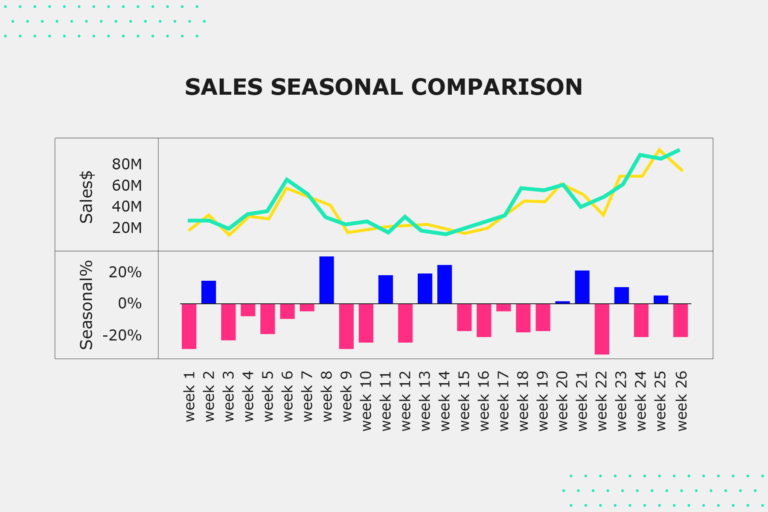
The figure shows a fairly similar trend year over year [YoY], but also measures the YoY percentage difference for consistency or to highlight any major deviations.
Lights, camera, predictive analytics
In a research paper titled ‘Early predictions of movie success: the who, what, and when of profitability’, Lash and Zhao proposed a framework that uses the principles of predictive analytics and predictive modelling to help investors make decisions (eg, about which movies to invest in) based on predictions of profitability using the regression analysis model.
If you want to read more about this 2016 research, results, and other findings, click on the link below.
Read: Early predictions of movie success: the who, what, and when of profitability [3]
You can see that predictive analytics is not ivory-tower analysis, but it does help us to get insights that are relevant for business. Similarly, predictive modelling, as Gartner puts it in their glossary, is a statistical technique to analyse the past performance to assess how likely a customer is to exhibit a specific behaviour in the future.[4] These models seek ‘subtle data patterns’ to answer predictive questions. If businesses can predict trends, they are in a better position to meet targets.
Share your thoughts
From oil companies to the movie industry – everyone’s using predictive analytics. What do you think the future holds for the advancement of predictive analytics? Share your thoughts in the comments below.
References
1. Predictive analytics market by software solutions (Press release) [Internet]. Zion Market Research. Available from: https://www.zionmarketresearch.com/report/predictive-analytic-market
2. Watcher, S [Blog]. Generate predictions in Tableau with predictive modeling functions. Tableau; 2020 Jul 2. Available from: https://www.tableau.com/about/blog/2020/7/generate-predictions-tableau-predictive-modeling-functions
3. Lash MT, Zhao K. Early predictions of movie success: the who, what, and when of profitability [PDF]. 2016 Jan 29. Available from: https://arxiv.org/pdf/1506.05382v2.pdf
Data Visualisation: Data Dashboards and Storytelling with Tableau


Data Visualisation: Data Dashboards and Storytelling with Tableau
Reach your personal and professional goals
Unlock access to hundreds of expert online courses and degrees from top universities and educators to gain accredited qualifications and professional CV-building certificates.
Join over 18 million learners to launch, switch or build upon your career, all at your own pace, across a wide range of topic areas.


