
Judicial Statistics 2020
In the previous step, we read the overview of the Judicial Statistics 2020 Report. Here, we present some selected statistics about judges in post as at 1 April 2020 from the main text of the report, to inform our understanding of the current profile of the judiciary, tribunal members and magistrates, and how it has changed since 2014.
As noted in the last step, the report focuses on the characteristics for which there is the most reliable data.
We shall reflect on these statistics as we progress through the week, and you can test your knowledge in the quiz in a later step.
If you would like further information, you can read the full report here
Gender
As at 1 April 2020, women represented: • 32% of all court judges – 1 percentage point higher than in 2019, and 8 percentage points higher than in 2014. • 47% of all tribunal judges – no change from 2019 and 4 percentage points higher than in 2014.
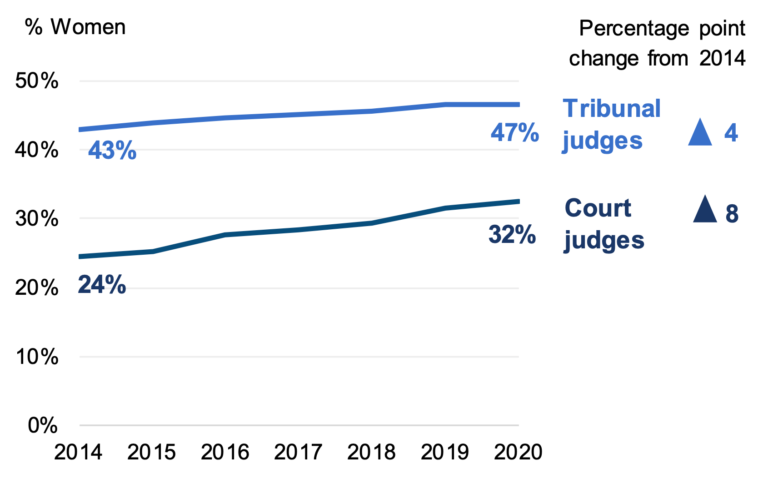
• 52% of all non-legal members of tribunals (7 percentage points higher than in 2014) • 56% of all magistrates (4 percentage points higher than in 2014).
In the courts, 26% of judges in more senior posts (High Court and above) were women. The highest level of representation for women was among the District Judges (County Courts) at 44%.
Ethnicity
As at 1 April 2020, BAME individuals represented: • 8% of all court judges, no change compared the previous year and 2 percentage points higher compared to 2014 • 12% of all tribunal judges, no change compared the previous year and 2 percentage points higher than 2014.
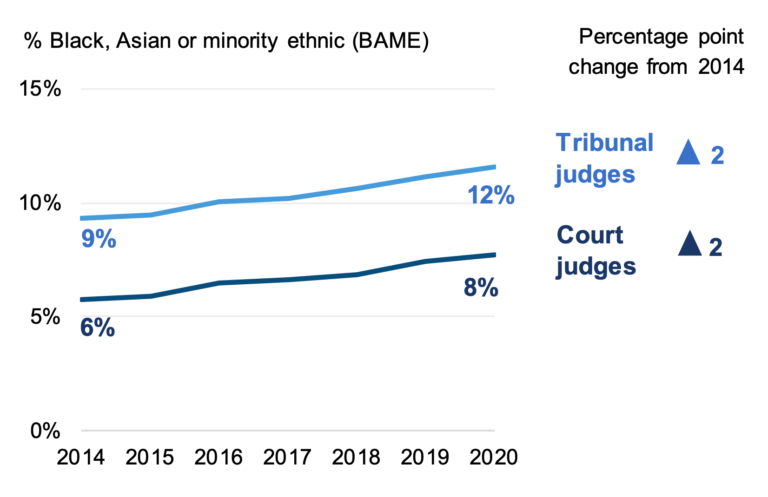
• 16% of all non-legal members of tribunals (1 percentage point higher than in 2014) • 13% of all magistrates (a 5 percentage point increase from 2014 when 8% declared themselves as BAME).
Age
• At 1 April 2020, around three-quarters of judges were aged 50 and over – 76% in courts, and 72% in tribunals. In both courts and tribunals, 40% of judges were aged 60 and over. • Non-legal tribunal members tended to be older than judges on average, with 85% of those in post being 50 and over, and 57% being 60 and over. This is similar to magistrates in post, where 82% were aged 50 or over, and 49% aged 60 and over.
Professional background
As at 1 April 2020: • non-barristers represented 32% of all court judges and 63% of all tribunal judges. Compared to 2014, this is a 4 percentage point decrease among court judges, and compared to 2015 a 5 percentage point decrease among tribunal judges.
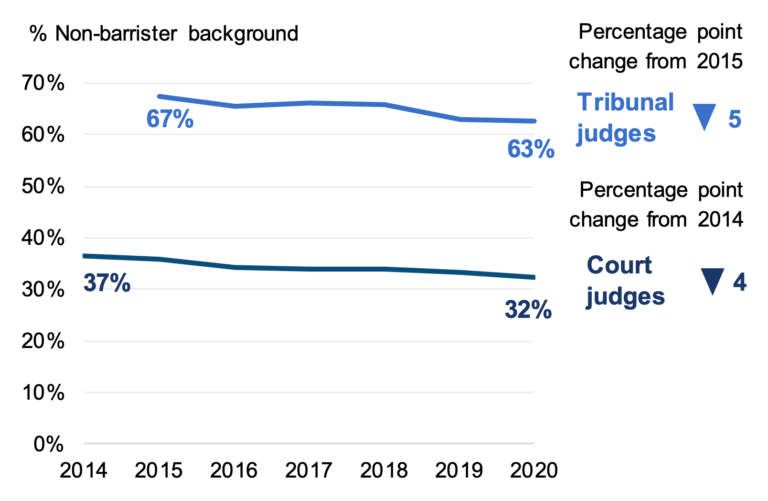
• the majority of judges from a non-barrister background were former solicitors with only 5 court judges and 31 tribunal judges coming from a legal executive or any other legal background
The Modern Judiciary: Who They Are, What They Do and Why it Matters


The Modern Judiciary: Who They Are, What They Do and Why it Matters
Reach your personal and professional goals
Unlock access to hundreds of expert online courses and degrees from top universities and educators to gain accredited qualifications and professional CV-building certificates.
Join over 18 million learners to launch, switch or build upon your career, all at your own pace, across a wide range of topic areas.


