Skip main navigation

Reducing the impact of motorised transport: An overview

An overview of the four categories of interventions to limit emission and pollution in the transport sector.

The Transport Policy for Air Quality course will provide an overview of transport policy approaches and interventions to reduce transport-specific emissions in cities and regions.

According to the International Energy Agency (IEA), transport was responsible for 27% of global greenhouse gas emissions in 2019. The majority of these emissions are attributable to road transport, in particular private vehicles and trucks.

Emission and pollution reduction strategies in the transport sector therefore typically take specific aim at road transport:

‘Calculations show that on the most optimistic assumptions about the role of electric vehicles, considerations of climate change as an emergency imply that we need to reduce the amount of car use by a minimum of approximately one-third in the next 10 years, and it may well be more.’
(Goodwin and Curtis, 2020, p437)

Four categories of interventions

Policymakers distinguish between four categories of interventions (see Dia et al, 2019):

Avoiding travel

This is generally achieved by directing urban growth and redevelopment in ways that enable shorter journeys, and/or (alternatively or complimentarily) encourage transport users to choose destinations in greater proximity to their homes. Practices such as working from home, e-commerce etc. also fall in this category. Planners sometimes speak of a ’15-minute-city’ as an objective, ie an urban environment where the majority of daily tasks can be performed within a 15-minute carfree journey from the home.

Shifting travel to non-car modes

This involves investing in public transport infrastructure and services to make them more competitive with the car, and to make active transport (walking and cycling) safer and more convenient. It also involves financial and regulatory incentives and disincentives towards the desired mode shift: cheaper public transport tickets, developer contributions towards the cost of public transport, parking restrictions and pricing, redistribution of road space away from cars etc.

Sharing travel

This concerns the attempt to reduce the specific emissions impact of each vehicle or each vehicle journey by increasing their efficiency. Shared rather than individual ownership of cars (or bicycles, scooters etc) can reduce the number of vehicles in a city while putting each vehicle to greater use. Pooling rides in shared vehicles can increase the number of persons per trip. Innovative logistics concepts can reduce the number of truck journeys relative to the goods they carry.

Improving vehicle technology

This concerns the reduction of the emission intensity of remaining car journeys. In the 2020s, this is primarily pursued by gradually converting the car, bus and truck fleet to battery-electric (and for some larger vehicles, hydrogen) propulsion. This transition is supported by infrastructure measures (eg providing charging stations powered by clean, decentralised energy) and financial or regulatory incentives (eg tax breaks for electric vehicles or percentage targets of total vehicle sales).
A further distinction of policy measures will concern us in the following exercises. Each of the four policy fields above contains measures that we can classify as:
  • ‘hardware’ interventions: changes to transport infrastructure, the urban form, and to the vehicles used (thus focussing on the ‘supply’ side of the transport-land use system).
  • ‘software’ interventions: targeted at the behaviour of users: incentives and disincentives, financial and regulatory, to encourage the use of public and active transport over cars, and to make cars and their patterns of usage cleaner and more energy-efficient (planners also speak of ‘demand management’ in this context).
Effective policy often employs a well-targeted and integrated combination of ‘hardware’ and ‘software’ measures:
‘The key to successful sustainable transport policies is that regulation, pricing, new investment, parking control, priorities in road design, and enforcement must all pull together in the same direction, consistently enabling a better life with less car use. In general, this will nearly always mean that ‘carrots’ and ‘sticks’ have to be used in parallel.’
(Goodwin and Curtis, 2020, p442)
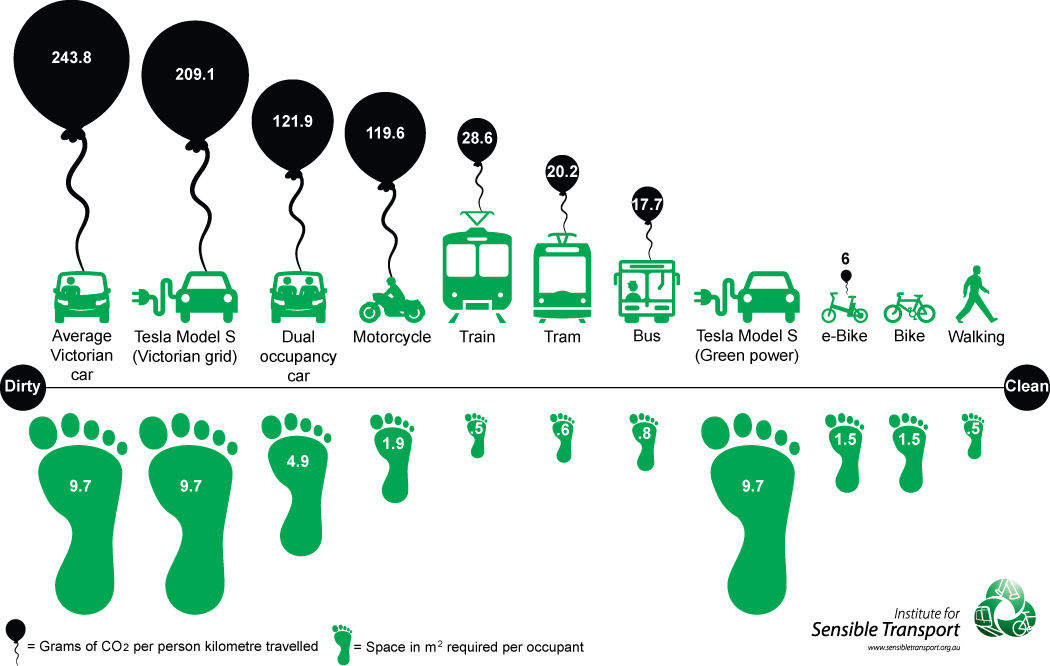
The following infographic illustrates the emissions intensity and spatial requirements of different modes of urban transport.
Note: the CO2 intensity of electric vehicles depends on the methods of power generation, which vary between countries and regions (Victoria, Australia, the reference region for this graph, has a relatively high dependency on fossil fuels for electricity).

The contrast between dirty and clean transport modes and the space each mode consumes, with black balloons illustrating the emissions, on a per person, per kilometre basis. The space consumption per square kilometre required per occupant is illustrated by green footprints. Take a closer look

Image source: Institute for Sensible Transport

References

  • Dia H, Taylor M, Stone J, Somenahalli S, Cook S (2019) Low carbon urban mobility. Chapter 14 in Newton P, Prasad D, Sproul A, White S (eds) Decarbonising the Built Environment. Charting the Transition. Palgrave Macmillan, Singapore, pp 259-285.
  • Goodwin P, Curtis C (2020) Sustainable transport – looking back, looking forward. Chapter 44 in Curtis C (ed) Handbook of Sustainable Transport. Edward Elgar Publishing, Cheltenham, UK, pp 434-446, https://doi.org/10.4337/9781789900477

Web resources

Can cities influence the behaviour of transport users with the aim of reducing the use of cars? Let’s find out in the next step.

© RMIT Europe and EIT Urban Mobility
This article is from the free online

Transport Policy for Clean Air

Created by
FutureLearn - Learning For Life

Reach your personal and professional goals

Unlock access to hundreds of expert online courses and degrees from top universities and educators to gain accredited qualifications and professional CV-building certificates.

Join over 18 million learners to launch, switch or build upon your career, all at your own pace, across a wide range of topic areas.

Start Learning now