
Are human activities tipping the climate balance?
Earlier on, you have learnt about climate change and the main cycles that control the dynamics of the climate. Now it is time to explore what climate change is and what role human activities play in it. In this article, we will dig deeper into the relationship between the increased emission of greenhouse gases and global warming.
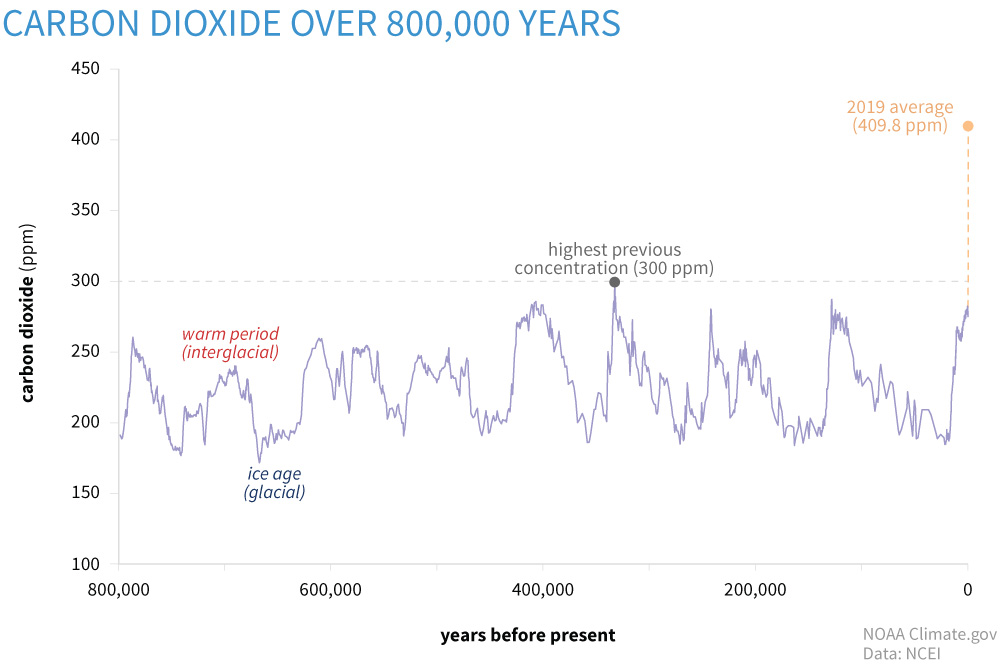
The CO2 concentration in the atmosphere has never exceeded 300 parts per million (ppm) in the past 800,000 years. But CO2 concentrations in 2018 reached 407.4 ppm Ades et al., 2020, which is significantly higher than those observed during warmer interglacial periods.
Figure (1) shows the global atmospheric carbon dioxide concentrations (CO2) in parts per million (ppm) for the past 800,000 years. The peaks and valleys track ice ages (low CO2) and warmer interglacials (higher CO2). During these cycles, CO2 was never higher than 300 ppm, (Lindsey, 2020)
<img src="https://raw.githubusercontent.com/suhybsalama/CCI_MOOC/main/images/LAND/BAMS_SOTC_2019_co2_paleo_1000px.jpg" alt=" 800,000 of CO2“> Figure 1: Global atmospheric carbon dioxide concentrations (CO2) in parts per million (ppm) for the past 800,000 years. From NOAA based on Lüthi, et al., (2008). (Click to expand)
Research findings provide conclusive evidence that human activities are the leading cause of increased levels of carbon dioxide in the atmosphere, which are causing climate change (IPCC, 6th Assessment Report 2021). Most fossil carbon (e.g., oil and gas) has been extracted in the past 50 years, and extraction rates are rising exponentially (Heede, 2014 and Ritchie and Roser, 2017). As a result, by 2020, the mean CO2 concentration in the atmosphere has risen roughly 50% compared to pre-industrial times. Approximately 30% and 25% of the excess CO2 is absorbed by terrestrial ecosystems and the ocean, respectively (Ballantyne et al., 2012), and 45% remains in the atmosphere. Each year, 5.5 TgC (billions of metric tons of carbon) are released into the atmosphere by the burning of fossil fuels, while only 3.3 TgC/yr accumulate in the atmosphere. Consequently, the amount of CO2, a potent greenhouse gas, drastically increased in the atmosphere and caused significant global warming and imbalance in the energy, water and carbon cycles.
Climate change
Climate change refers to changes in weather patterns, as well as changes in oceans, land surfaces, and ice sheets that describe Earth’s local, regional, and global climates, occurring on time scales of decades or longer (Houghton et al., 1990). According to IPCC, climate change is defined as an alteration in the climate condition, which can be discovered employing statistical analysis on changes in the climate properties over time (usually 30 years), regardless of whether it is caused by natural variability or anthropogenic activity. It is worth mentioning that the IPCC’s definition of climate change differs from that of the United Nations Framework Convention on Climate Change UNFCCC. UNFCCC describes climate change as a change in climate caused by anthropogenic activity that alters the global atmospheric composition. The main factor of anthropogenic activity changing the climate is the increased greenhouse emission due to fossil fuel combustion and industrial processes (Fischedick et al., 2014).
Effects of increased levels of greenhouse gases
The Earth’s surface receives radiation from the Sun. Part of this radiation is reflected and part of it is absorbed, then re-emitted at the wavelength corresponding to the temperature of the surface. Without an atmosphere, the radiation leaving the Earth’s surface would be lost to space and the temperature on Earth would be far below the freezing point. Greenhouse gases absorb the long-wave radiation emitted by the Earth and re-emit it in all directions, so only some of it escapes to space. The natural effect of greenhouse gases is shown schematically in Figure (2-left panel). Water vapour contributes most to the total greenhouse effect, as it absorbs radiation in a wide range of frequencies. The anthropogenic (human-caused) enhancement of the greenhouse effect (Figure 2-right panel) is, however, mainly due to carbon dioxide, owing to the sheer amount of CO2 emitted into the atmosphere (Buchwitz et al.,2017). Methane and nitrous oxide (N2O) concentrations are also enhanced by anthropogenic activities. Although present in smaller amounts, they are much more potent greenhouse gases than CO2.
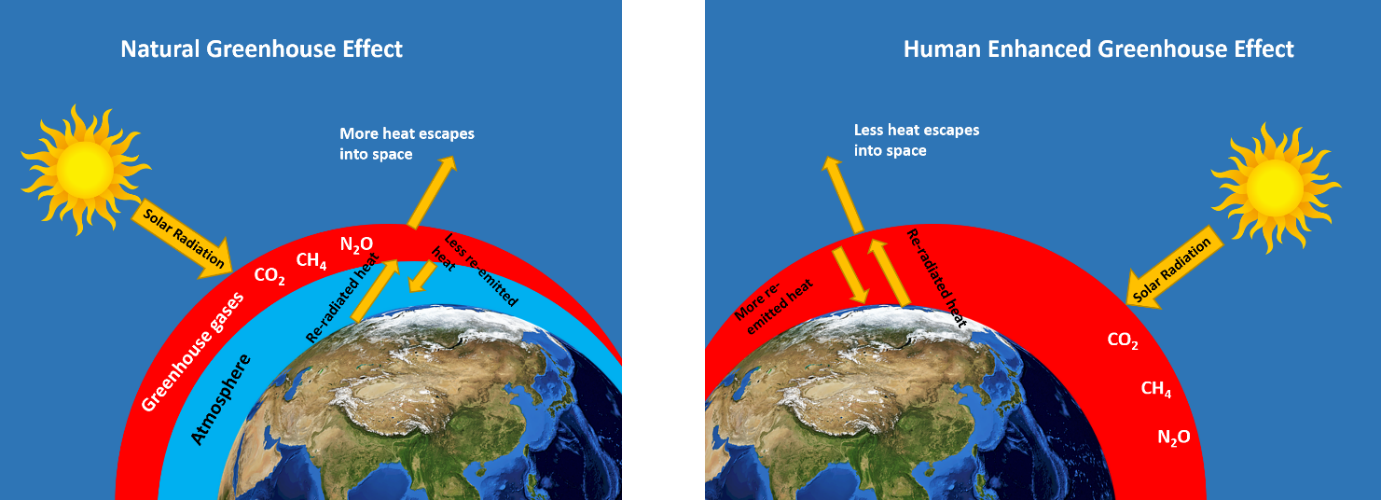 Figure 2: Schematic of the greenhouse effect: natural (left panel) and human-enhanced (right panel) effects of greenhouse gases. Reproduced by Elnaz Neinavaz (UT-ITC) Click to expand
Currently, CO2 levels in the atmosphere are 40% greater than they were prior to the Industrial Revolution. Since 2007, the concentration of CH4 in the atmosphere has been constantly rising. Burning fossil fuels, waste management, and deterioration of wetlands are considered dominant anthropogenic sources of methane CH4 in the atmosphere (Turner et al., 2019). The energy added to the Earth system by enhanced effects of greenhouse gases is called radiative forcing. Positive radiative forcing causes global warming, and negative radiative forcing causes cooling (Smithson, 2002) which influences other aspects of the Earth’s climate system due to the cycles (energy, water, carbon) connecting the atmosphere to the land and oceans (Piontek et al., 2014).
In addition to fossil fuel combustion and industrial activities, the emission of greenhouse gases is enhanced due to deforestation, contributing up to 20% of carbon emissions (Myhre et al., 2013, Turner et al., 2019) and coal mining, contributing to 60% of methane global emission (Kholod et al., 2020)
The Climate Change Initiative Greenhouse project merged different satellite missions and provided empirical evidence of the global increase of carbon dioxide and methane emissions on a global scale (Reuter et al., 2020), as shown in Figures (3) and (4).
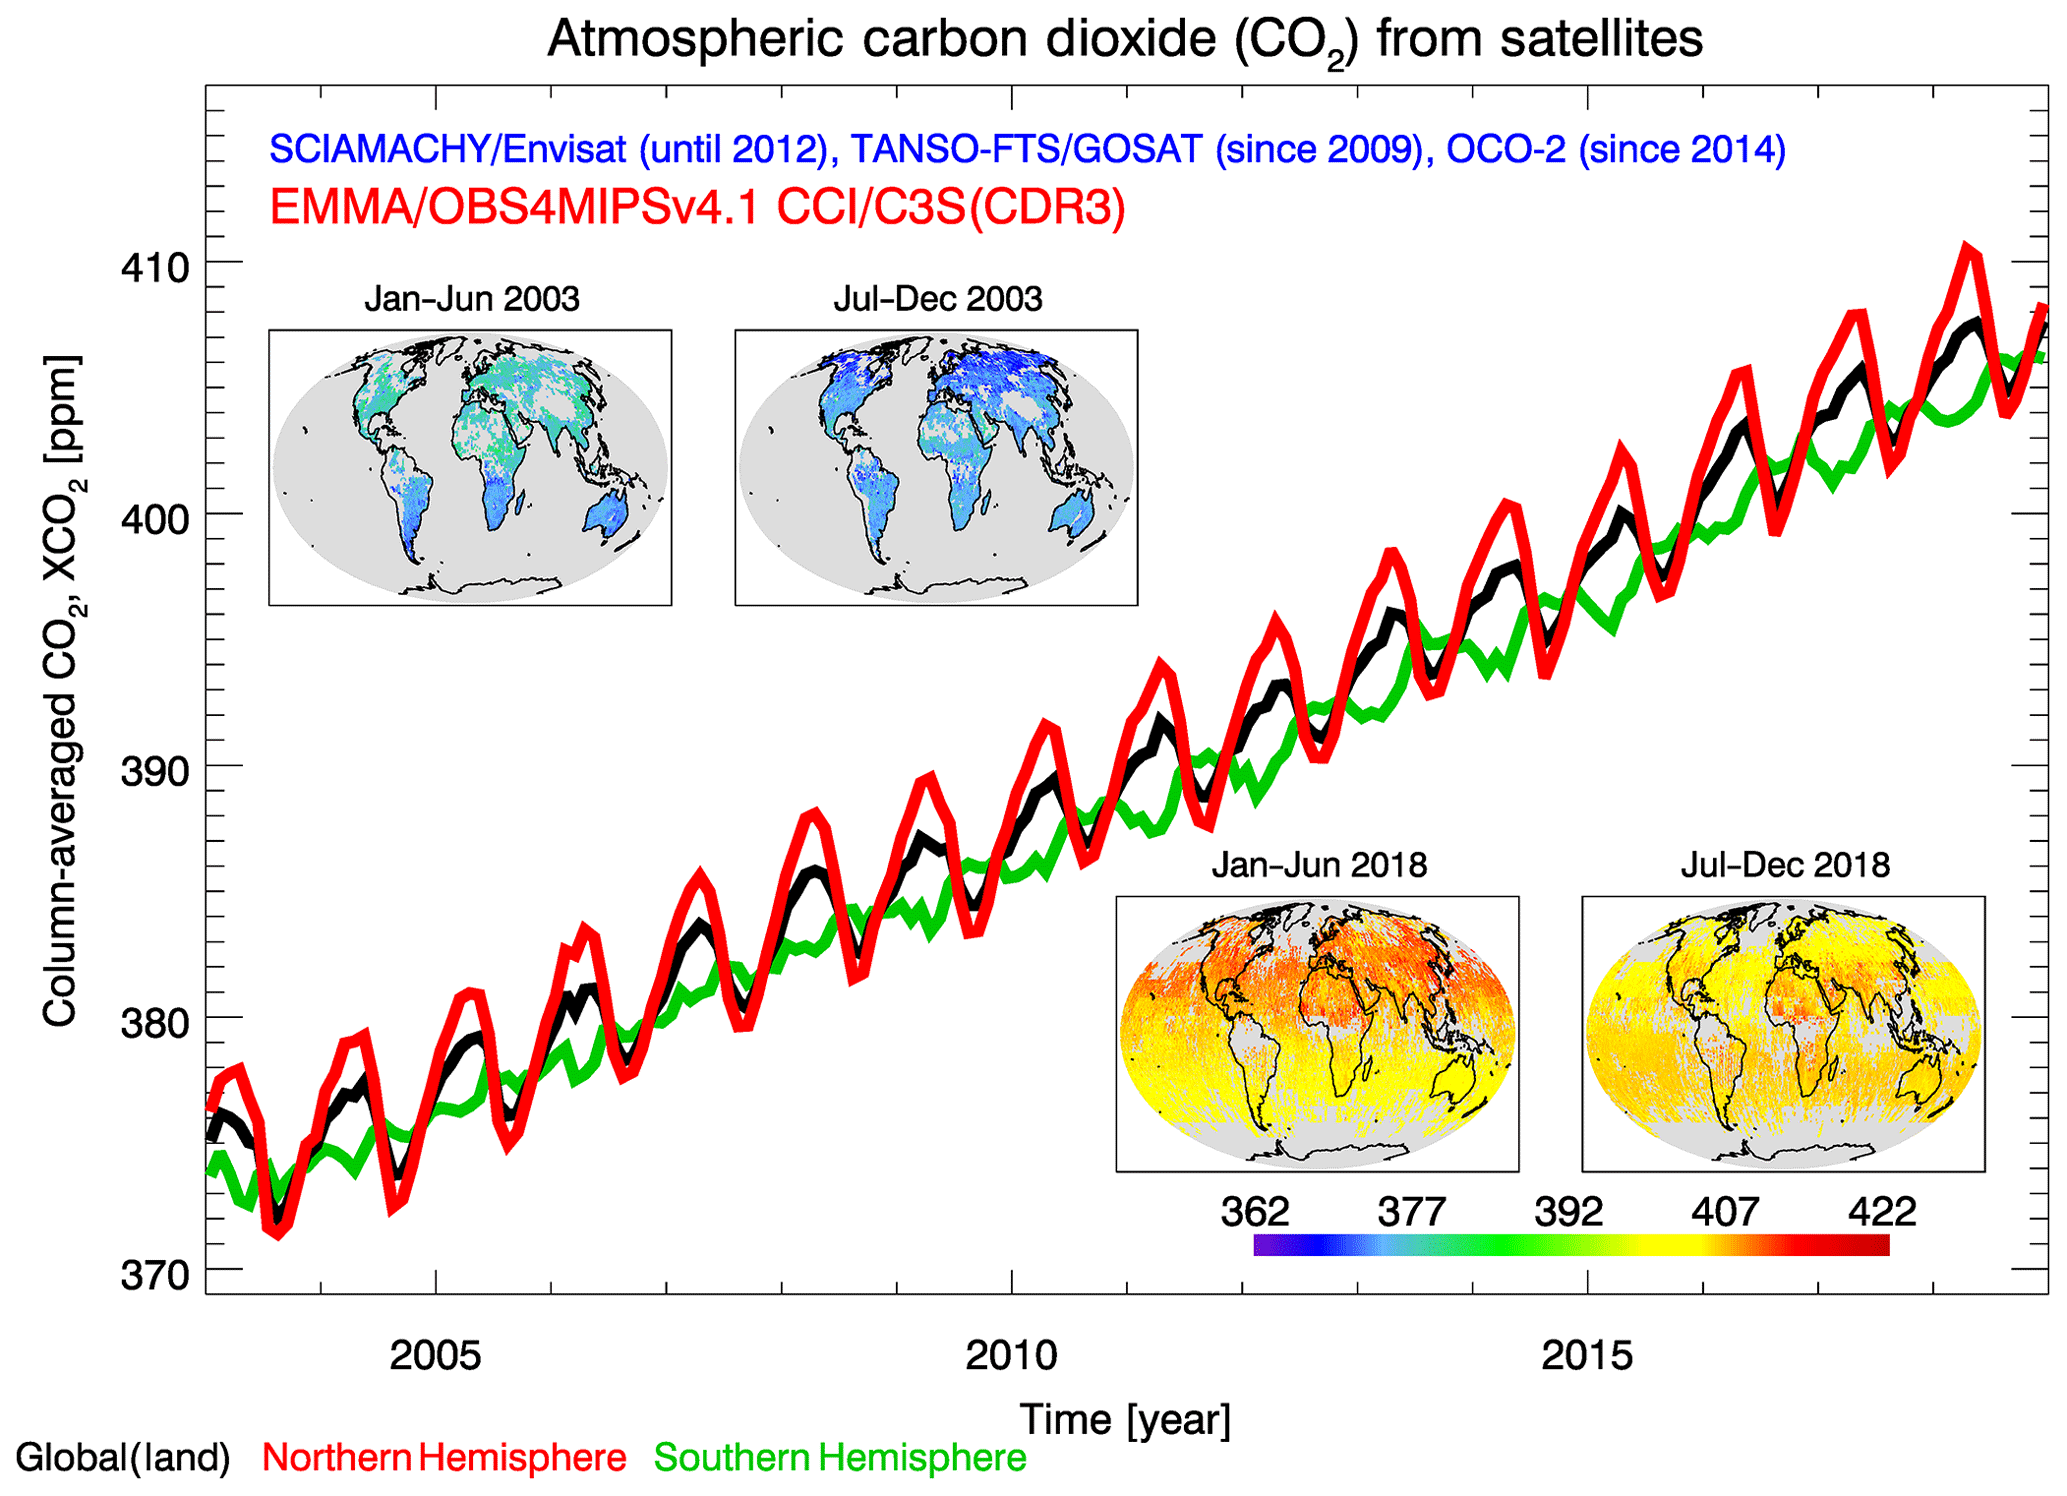 Figure 3: Time series of CO2 for three latitude bands (global on land, black line, Northern hemisphere, red; Southern hemisphere, green) and global map (half-yearly average). From Reuter et al., (2020). Click to expand
 Figure 4: Time series of methane (CH4, lower panel) for three latitude bands (global on land, black line, Northern hemisphere, red; Southern hemisphere, green) and global map (half-yearly average). From Reuter et al., (2020). (Click to expand)
Up next
In the next video, you will capitalise on the knowledge you gained so far. Then we will go a step further, inspecting a few more aspects of the urgency for reduced human emission of CO2.
Understanding Climate Change using Satellite Data


Understanding Climate Change using Satellite Data
Reach your personal and professional goals
Unlock access to hundreds of expert online courses and degrees from top universities and educators to gain accredited qualifications and professional CV-building certificates.
Join over 18 million learners to launch, switch or build upon your career, all at your own pace, across a wide range of topic areas.


