
Turning back the clock with historical data
Archaeologists can use historical imagery and topographic maps to see how their area of interest looked in the recent past. Lots of this data dates to the 20th century, relating to the World Wars or the Cold War, or to efforts by colonial powers to document and thus improve their control of occupied territory. How can these old maps or imagery be of any use to archaeologists not studying the recent past?
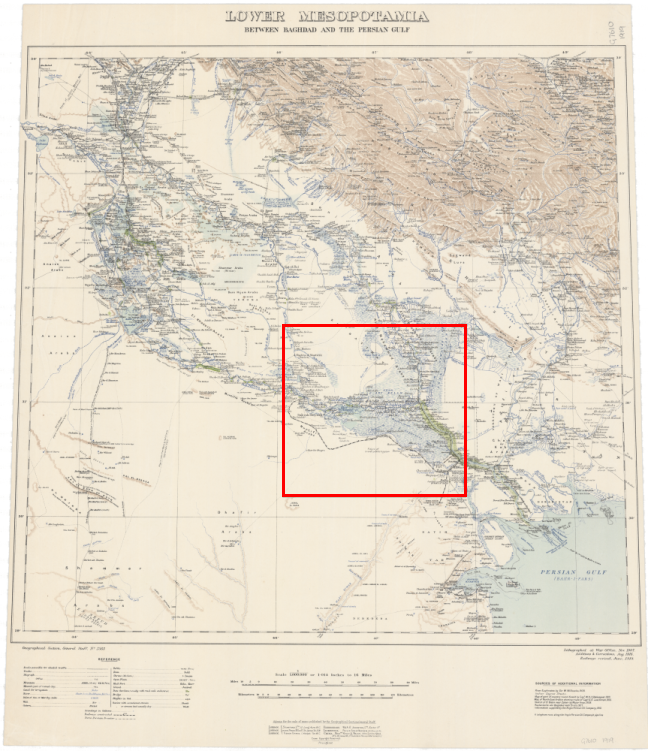
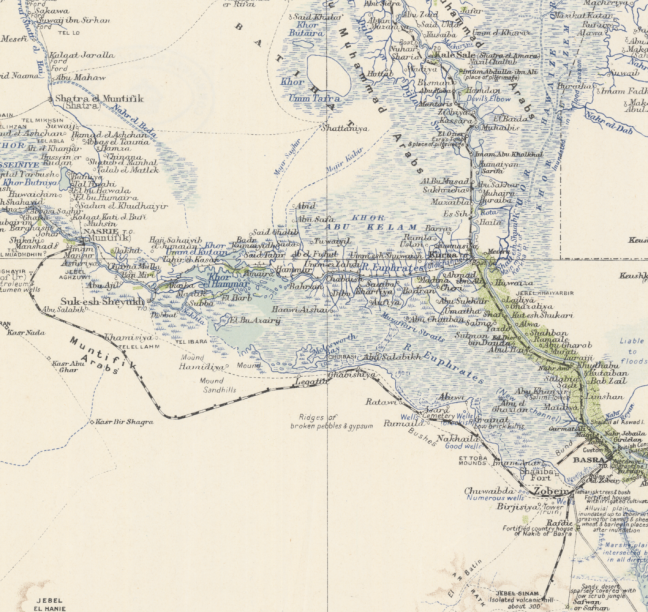 Colonial map of Lower Mesopotamia (modern-day southern Iraq) showing recently constructed railways built to cement British control of the area. Geographical Section General Staff, Lower Mesopotamia, 1919.
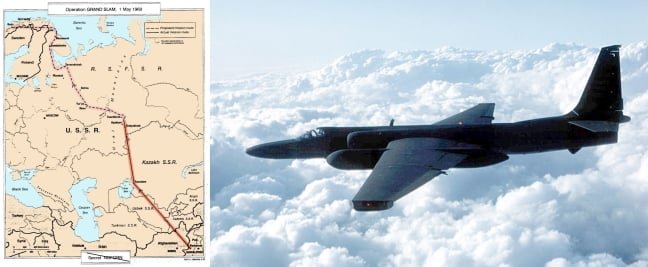 US Air Force U2 spy plane designed to fly at extremely high altitudes (right) and declassified reconnaissance mission map (left). A huge quantity of spy photography was taken by planes and satellites during the Cold War. Courtesy of the US Air Force and CIA.
The last sixty years has witnessed a dramatic transformation of the landscape across the Middle East and North Africa. Today the region has a population of around 475 million people, but if you go back to 1960 it was less than a quarter of the size it is now. People need places to live and work, so housing, industry and all the associated infrastructure has had to keep pace with this rapid population growth. This expansion has put tremendous pressure on archaeological sites – with huge numbers destroyed or disturbed in this period.
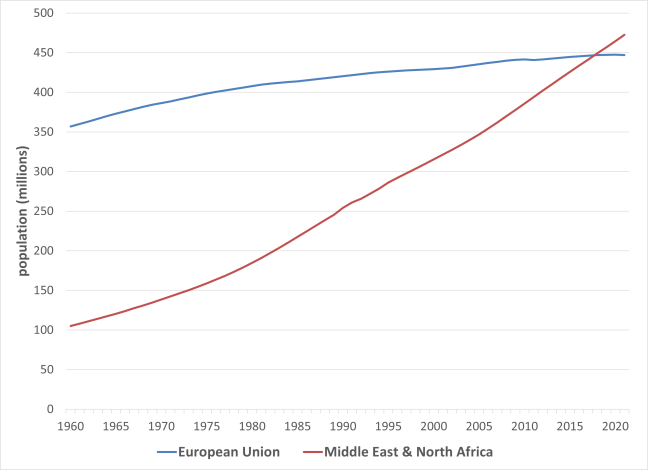 Population growth in the European Union and the Middle East and North Africa since 1960. Data courtesy of the World Bank.
To feed this rapidly growing population agriculture has also expanded. The area being farmed for arable crops, such as wheat in the region, has more than doubled since 1960, and this has often been to the detriment of archaeological sites. Farming has also become much more mechanised compared to more traditional agricultural methods still practiced in the mid-20th century. There was a six-fold increase in the number of tractors in-use between 1960 and the early 2000s! This mechanisation damages archaeology – sites are ploughed much more deeply or can be cleared away completely to expand fields.
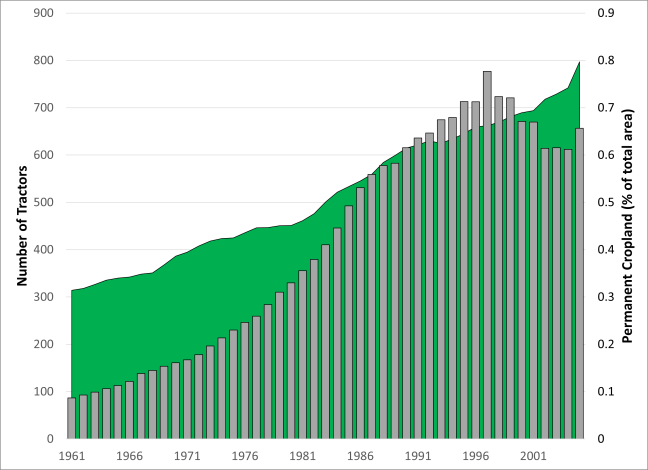 Graph showing the increase in permanent cropland (in green) and the number of tractors (in grey) in the Middle East and North Africa between 1961 and 2005. Data courtesy of the World Band/FAO.
Faced with this ferocious pace of urban and agricultural expansion, governments struggle to prevent wholesale destruction of archaeological sites. While we cannot reverse the damage done to archaeology during the last sixty years, historical data can give us insights into how the landscape looked before it occurred.
It is also important to understand that people need food to eat and places to live! We can’t stop all urban and agricultural expansion to save every archaeological site. For prioritisation and decision-making to be effective we need accurate information on the nature and distribution of heritage resources to make informed decisions about what needs to be protected. Historical data can help with this.
Are there any sites in your area of interest where historical data would be especially helpful in turning back the clock?
Historical imagery
There is a wide range of historical imagery that can be useful to archaeologists. For example, the British Royal Air Force took extensive photographs during World War II, including in parts of the Middle East. The US government deployed high-altitude aircraft to photograph Soviet controlled areas during the Cold War. Private aerial photo companies also completed surveys to facilitate the modernisation of agriculture and water management in the region.
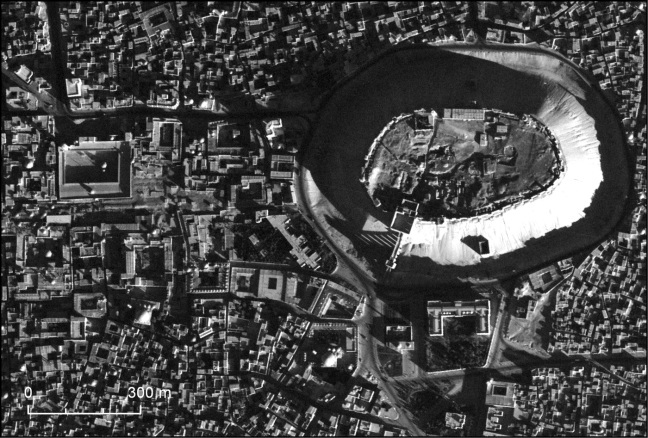 U2 photograph of Aleppo, Syria from 1959 showing the high mound of the citadel (right) and the buildings and alleyways of the medieval city. Figure 1 from Hammer, E. and Ur, J. 2019. Near eastern landscapes and declassified U2 aerial imagery. Advances in Archaeological Practice, 7: 107-126.
We are going to look at the American Corona space photography program in detail, as it covered a huge area, and the data is easily accessible.
Corona space photography
The top-secret Corona program deployed the USA’s first ever spy satellites, between 1960 and 1972, to take photos over the territory of the Soviet Union and its allies, without risking the loss of aircraft and pilots. It came about as a direct result of the Soviet Union’s successful Sputnik satellite launch, with huge investment made by the US government to catch-up. The shooting down of a U2 spy plane over the Soviet Union in 1960, and the capture of its pilot, also helped encourage the US to develop safer alternative intelligence collection methods! The photographs from this secret mission were only declassified in 1996.
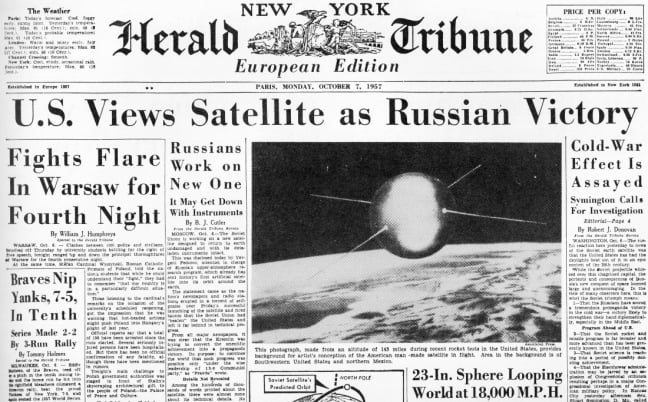 The successful launch of the Soviet Union’s Sputnik 1 led to the approval of the US Corona program. New York Herald Tribune, 07/10/1957.
Over the course of the twelve years of the Corona program 144 satellites were launched. Nearly 900,000 photos were taken, covering a huge area of the globe although with a clear bias towards the Soviet Union and its presumed allies! The satellites used one or two panoramic cameras to take photos repeatedly as they orbited the Earth.
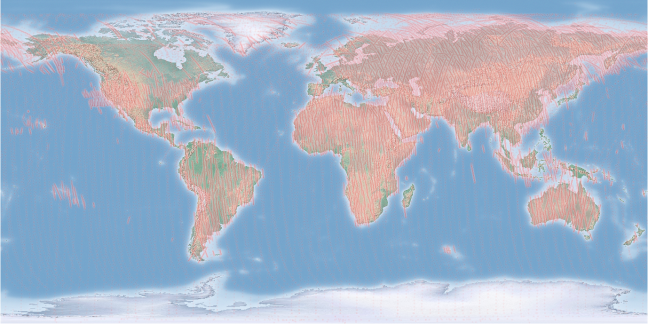 Corona image locations – coverage is global despite an intense focus on the former Soviet Union. Data courtesy of Natural Earth and the USGS.
Incredibly, these were film cameras, rather than the sort of digital sensors we learned about in Week 2, which means that the films had to be physically recovered from the satellites! When a film was used up, a special capsule would separate from the satellite and drop to Earth. These film capsule would then deploy a parachute, and either be caught mid-air by plane, or retrieved from the sea.
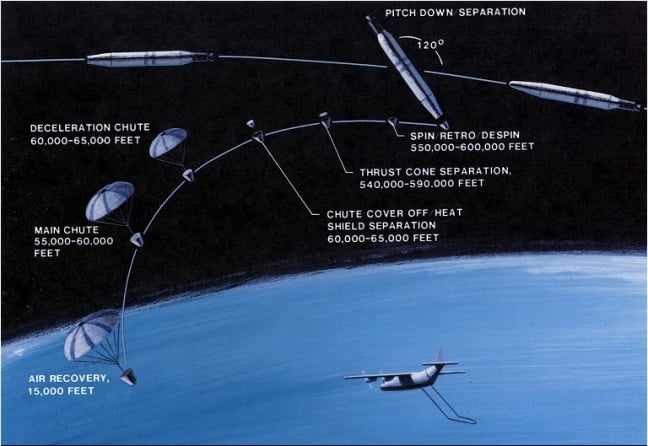 Diagram demonstrating the recovery procedure for Corona film capsules. Courtesy of the US National Reconnaissance Office.
The amazing Corona satellite cameras used films that were 7cm wide and 76cm long. These very long and thin photos would be taken one after another, stacking horizontally to cover large areas of ground as the satellites moved in their orbit. Each film strip covers an area of about 200km width on the ground, with the dozens of film strips from an individual mission forming blocks around 1000 km in length. Later missions used two cameras pointed at a slightly different angle, allowing the images to be viewed in 3D using the right equipment – like a 3D movie at the cinema!
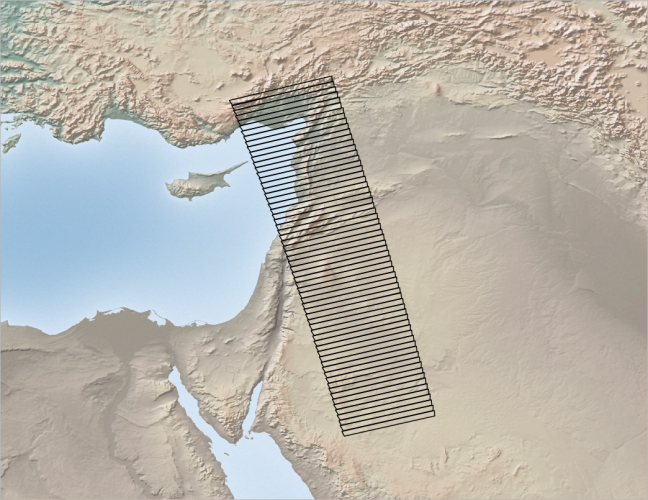 Dozens of films stacked horizontally from an individual mission form blocks around 1000 km long and 200 km wide. Data courtesy of Natural Earth and the USGS.
The films used for the Corona missions were black and white. The ground resolution of the photographs varies between about 12m and 2m. Not only were improvements made over time, but sometimes the film would come out more blurry than expected or over-exposed – too bright to see much detail.
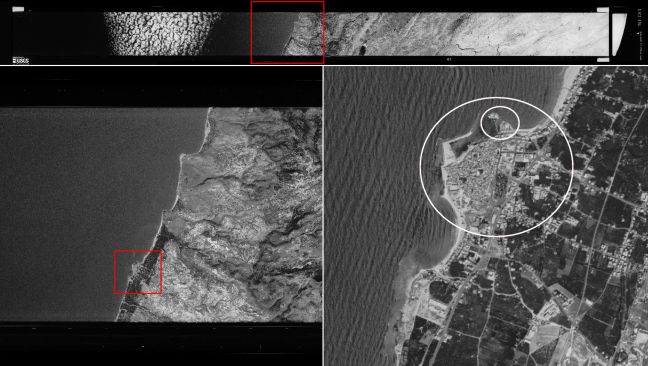 Example Corona image of the historic Lebanese town of Saida/Sidon from 1970. Despite being over fifty years old, plenty of detail is visible, including the Crusader Castle jutting out into the sea. Imagery courtesy of the USGS.
We are going to look at how Corona imagery can be useful to archaeologists in more detail later, but first we are going to discuss our second source of historical data.
Historical maps
Drawing accurate and detailed maps is a difficult, highly skilled, and very expensive process. Before satellites and computers, everything was drawn by hand, following intensive recording of information by teams of surveyors making measurements in the field. This meant that creating a map, or a whole series of maps, had to be worth the effort and expense! Usually this came down to one of three reasons: war; colonial control; or government intelligence.
War or other military activities
Huge numbers of maps were drawn during the First and Second World Wars. To move troops and equipment around effectively you need to know the terrain. All large armies include professional surveyors and mapmakers, and lots of maps tend to get drawn before or during large conflicts.
Although the military surveyors are not necessarily interested in archaeology, sites often get included on these maps as obvious features that would be helpful to orient those using them. In other cases – especially large settlement and burial mounds – these features are of military interest as positions in which to observe the area from, or on which to install large guns or other military equipment.
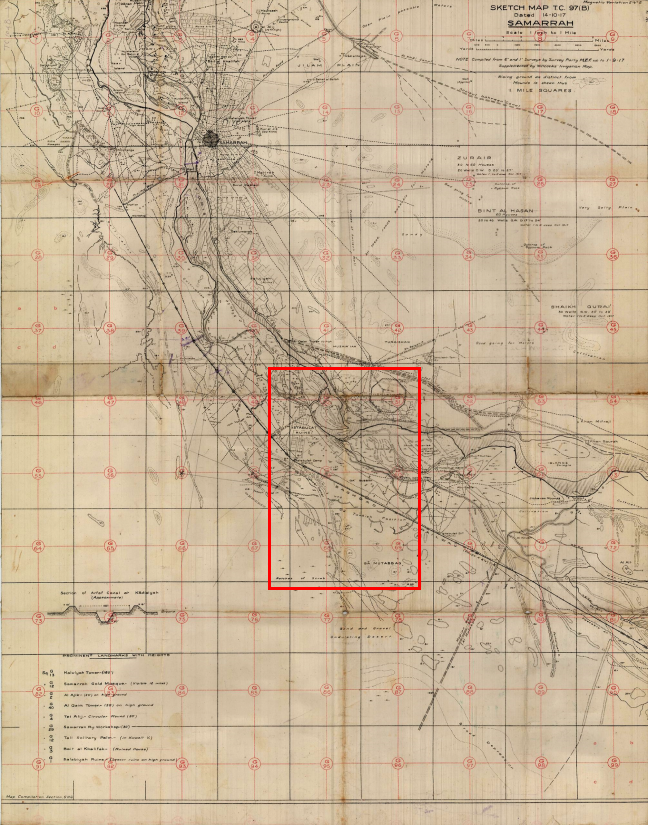
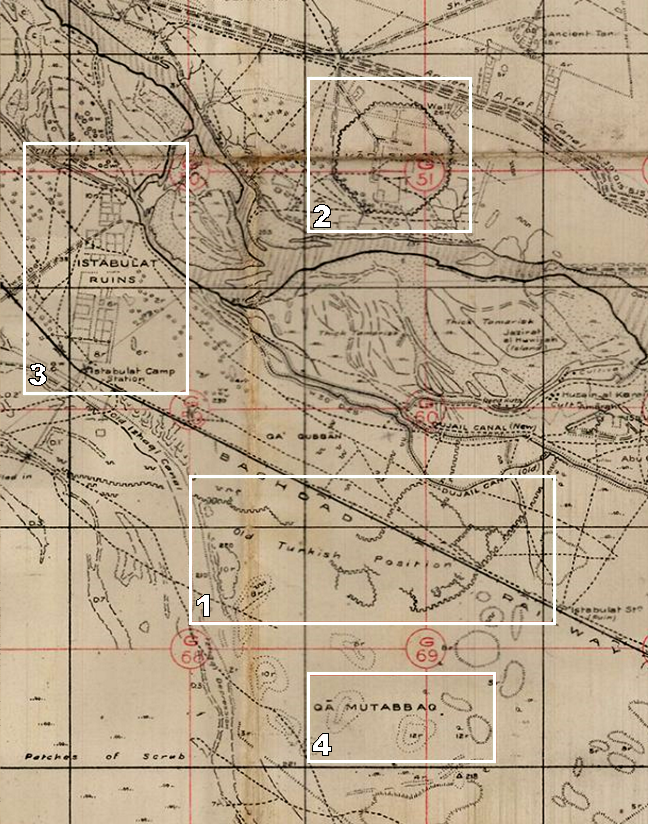 This British World War One map of Samarra, Iraq. It shows not only the location of the Ottoman trenches (1), but also an unfinished early Islamic walled city (2) and the ruins of a broadly contemporary settlement (3), as well as the location and height of dozens of older settlement mounds (e.g. 4). Mesopotamian Expeditionary Force Survey Party, map T.C. 97(B), 1917.
Other military activities can also yield maps of interest to archaeologists. Aeronautical charts, produced for the air force, often include archaeological sites as notable features to help pilots to work out their location.
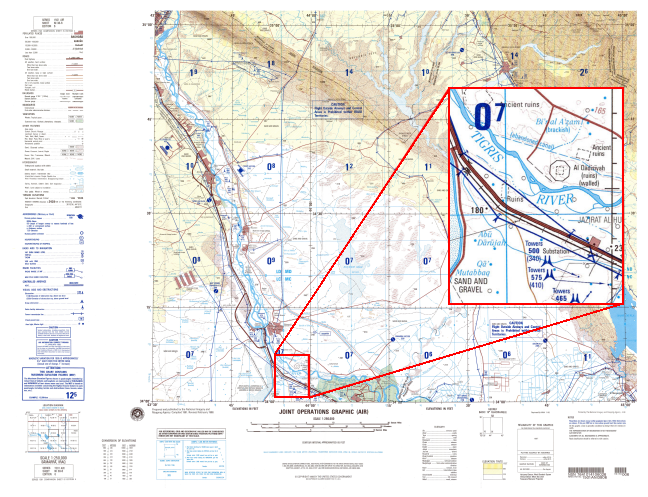 This aeronautical chart shows the same area of Iraq as the World War I map, including many of the same archaeological features. National Imagery and Mapping Agency, Series 1501 Air, Sheet NI 38-6, 1998.
Colonial control
The early- to mid-twentieth century witnessed a considerable expansion and consolidation of colonial powers. Accurate maps allowed foreign territory to be controlled and exploited more effectively, so during this period thousands of detailed maps were produced by Britain, France and others.
 This French colonial map of the Syrian-Iraqi border reveals a landscape littered with tells – ancient settlement mounds. Bureau Topographique des Troupes du Levant, Levant 1:200,000, Sheet NJ 37-VI, 1937.
Secret intelligence
Major political powers also collected maps as secret intelligence. The Soviet Union secretly mapped the entire globe at several scales. Soviet maps of US and UK cities included military bases and other sensitive data that were omitted from maps available to the public in the US and UK at the time!
 1:10,000 Soviet map of south-west Cairo from 1972, showing the citadel, one of the historic centres of the city. Soviet city maps, Cairo, 1972.
Archaeology!
Some of those producing these maps recognised their potential for studying archaeology. For example, Lieutenant-Colonel Beazeley was involved in producing the maps of Iraq for the British Army during World War I. After the war he wrote an article for the Royal Geographical Society describing how the aerial photography they used for map making could also be of great use in archaeology. He included annotated maps of Samarra, a centre of the early Islamic world, derived from the military maps they had been producing.
 Map of the central part of Samarra (Iraq) based on the military maps produced by the British Army. Figure 2 in Beazeley, G.A. 1919. Air photography in archaeology. The Geographical Journal, 53: 330-335.
After the Second World War, large-scale archaeological survey became much more common, and extensive site maps were drawn by archaeologists themselves. Robert McCormick Adams’ team mapped the location of thousands of archaeological sites in Iraq over an area almost the size of Switzerland! Adams produced excellent maps that are still very useful today, especially as the landscape has changed so much since his surveys in the 1950s and 1960s.
 Part of the map produced by Adams and his team during their first large-scale survey in southern Iraq. Map 1 and 2B in Adams, R.A. 1965. Land Behind Baghdad. Chicago: University of Chicago Press.
Advanced Archaeological Remote Sensing: Site Prospection, Landscape Archaeology and Heritage Protection in the Middle East and North Africa

Advanced Archaeological Remote Sensing: Site Prospection, Landscape Archaeology and Heritage Protection in the Middle East and North Africa
Reach your personal and professional goals
Unlock access to hundreds of expert online courses and degrees from top universities and educators to gain accredited qualifications and professional CV-building certificates.
Join over 18 million learners to launch, switch or build upon your career, all at your own pace, across a wide range of topic areas.


