
Types and sources of data
Types of data
As an analyst, you will be required to understand the key types into which any data can be categorised.
Structured and unstructured data
Gartner states that the majority of an organisation’s content, between 80% to 90%, is unstructured data [1], while the rest can be either structured or semi-structured data.
| Structured data | Unstructured data |
|---|---|
| Data has a machine-readable format. | Data requires a human to interpret. |
| Data adheres to a predefined data model. | Data need not adhere to any predefined model. |
| Data is in a tabular / rectangular format (columns display different attributes or variables, rows display a particular record). | Data is in the form of social media feed, results of research and development, surveys, call records, and so on. |
| Data can be entered, stored, queried, or analysed by machines. | Data requires human help to manually catalogue the data. |
| Analysts can leverage on the model to know how data is recorded, defining the different attributes present, and providing information about the data type and restrictions on their values. | Analysts can use machines to read each word, or sentence, but not to interpret the meaning. (This is where machine learning and other elements of artificial intelligence come in to play.) |
| Examples: Names, dates, phone numbers, currency or prices, heights or weights, word count or file size of a document, credit card numbers, and so on. | Example: Images (both human or and machine-generated), video files, audio files, social media posts, product reviews, mobile SMS, and so on. |
Semi-structured data
Some data is neither structured nor unstructured, which is called semi-structured data. Email is an example of semi-structured data. Email headers contain metadata like the date, language, and recipient’s email address, which are structured data. However, the email body, which contains your message, is unstructured.
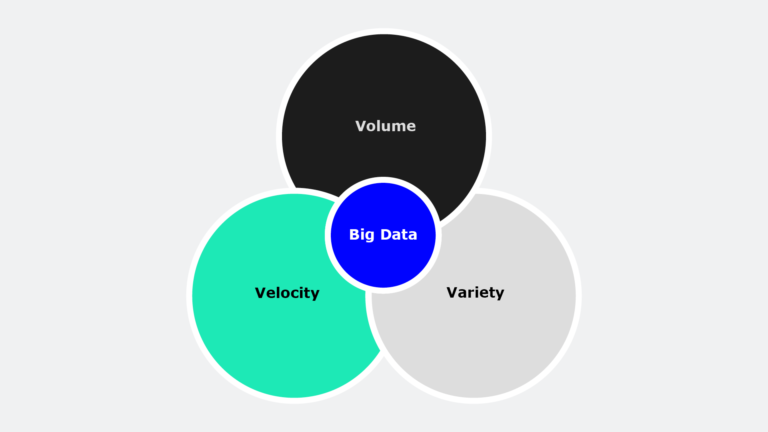
Big data
The term ‘big data’ is used to describe large, complex data sets of any type – structured, unstructured, or even semi-structured. While big data sets have been around since the 1960s, in the last 20 years there has been a considerable increase in the amount of data being created, or made available, especially by large online services (YouTube, Netflix, Salesforce, etc.).
Big data has three key properties: volume, variety, and velocity. Each of these properties present unique challenges.
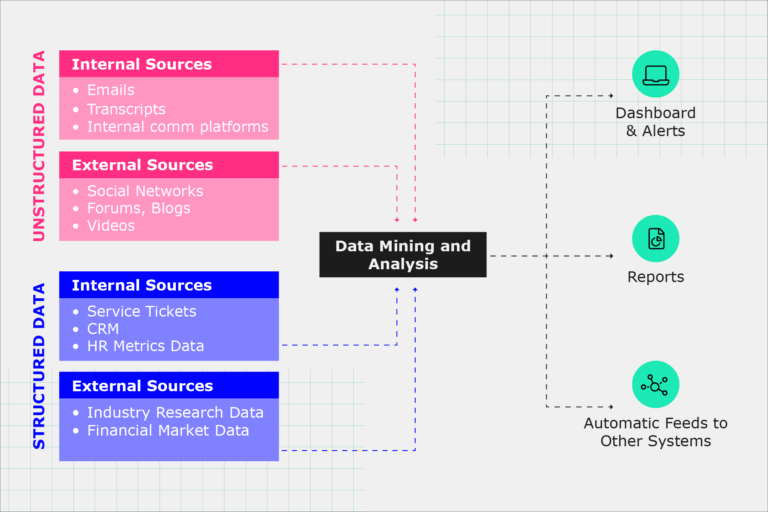
Sources of data
These days, in order to support better decision-making in business, the variety of data sources used by organisations to make better decisions is not limited to age old sources such as ERPs and CRMs. Let’s look at some of the current data sources.
Internal data
Internal data is data captured by your organisational processes. Your organisation may have machine-generated data available from sensors or devices used to manufacture a product, or recorded by the product itself (e.g. smartphones or IoT devices).
For example:
- transactional data (customer purchases and staff pay)
- email marketing metrics (email opens, click rates)
- information in customer profiles (names, addresses)
- records of customer interactions (email queries, support calls)
- online activity (placing items in an online shopping cart)
Third-party analytics
In some cases, you may not have the capacity to capture data, in which case third-party analytics can be used. Third-party web analytics services can provide cost-effective collection and analysis and evaluate how your website performs over time, or against averages across the provider’s customer base.
For example:
Google Analytics is a popular tool and provides businesses with the ability to analyse and better understand how users find and use their websites and pages. For more privacy-friendly analysis, such as what the government or health sectors choose to use, try Piwik Pro Analytics.
External data
External data can include almost anything from historical demographic data to market prices, or weather conditions to social media trends. Organisations use external data to analyse and model economic, political, social, or environmental factors that influence their business.
For example:
- Open sources (data.gov.uk) [3]
- Social media data (Twitter, Facebook, or LinkedIn)
- Paid sources (Thomson Reuters or Westlaw)
Open data
Open data is accessible to everyone and free to use. However, if it’s high-level data, or it’s heavily summarised and aggregated, it might not be very relevant to you. It might also not be in the format you need, or it might be very difficult for you to make sense of it. All of these challenges can require a lot of time to make the data usable.
For example:
- Government data: data.gov (US), data.gov.uk (UK), data.gov.au (AUS).
- Health and scientific data: World Health Organisation (WHO), Nature.com scientific data, Open Science Data Cloud (OSCDC), Center for Open Science.
- Social media: Google trends (i.e. look at national trends on search terms), Yahoo finance (great for stock market information), Twitter (allows you to search by tags and users, which can be downloaded by using Twitter APIs).
Source: Data Science Central [4]
On to you
What other factors do you think contributed to the increase in popularity of big data?Share them in the comments for your fellow learners. This is a chance for you to share your knowledge and also to learn more from others. Go, make use of it!
References
1. Do this, not that: Prescriptive analytics in sales and marketing [PDF]. quadient; 2019. Available from: https://www.google.com/url?q=https://www.gartner.com/imagesrv/media-products/pdf/quadient/Quadient-1-69GN2HQ.pdf&sa=D&ust=1601779598788000&usg=AFQjCNFd8jvlb-Abf5tLEAD7mbnj5nNffg
2. Quintero D, et al. IBM Data Engine for Hadoop and Spark [PDF]. Redbooks; 2016 Aug. Available from: http://www.redbooks.ibm.com/redbooks/pdfs/sg248359.pdf
3. data.gov.uk [Internet]. Available from: https://data.gov.uk/
4. Walker M. Structured vs. Unstructured Data: The Rise of Data Anarchy [Blog]. Data Science Central; 2012 Dec 19. Available from: https://www.datasciencecentral.com/profiles/blogs/structured-vs-unstructured-data-the-rise-of-data-anarchy


Reach your personal and professional goals
Unlock access to hundreds of expert online courses and degrees from top universities and educators to gain accredited qualifications and professional CV-building certificates.
Join over 18 million learners to launch, switch or build upon your career, all at your own pace, across a wide range of topic areas.


