
Here at FutureLearn, we’re passionate about helping people achieve their professional goals – so we closely follow the jobs market and which cities are most attractive to top professional talent. Looking for the latest info, we decided to use data and statistics to determine the best cities for jobs in 2020, and commissioned this study early in the year.
Since research began, the COVID-19 pandemic has transformed every aspect of our lives in a very short period of time, not least the economy and global career prospects. As an online distance learning platform, we’ve had the privilege of being able to offer people positive opportunities during this time. However, as we look towards the future, we’re aware that many people will be looking for new work.
Our poll of people living in countries such as France, Italy, and the USA found that an average of 50% of respondents had either lost their jobs entirely, or had their earning capacity reduced in some way since the beginning of the pandemic. As a result, we felt it was still valuable to go ahead with this research project, not only to offer hope and insight into the best cities for jobs, but also to take the time to reflect on the economic impact of COVID-19, and each government’s response to the crisis.
To conduct the study, we first determined a list of 100 cities around the globe which are renowned for their economic, educational, and aspirational opportunities. Whether a city has a strong economic position is an important indicator of its job opportunities, so we collected data relating to pre-coronavirus GDP growth rate, as well as the number of new startups, to illustrate if a city is a hub for innovation.
These statistics were then compared with the current unemployment rate versus joblessness this time last year, to help determine the pandemic’s impact on the job market. Next we looked at the government’s response to COVID-19 in terms of the support offered to businesses, such as loans and financial help (to both individuals and companies) and plans set in place to help ailing industries.
This section of the study was complemented with polls asking those in lockdown around the world to rate the adequacy of their government’s response to the crisis, and how the crisis has impacted their employment status.
Governmental policies were analysed next, focusing on workers’ rights, parental leave laws, governmental efficacy, and immigration statistics and sentiment. While the economy and government play a large role in what makes a city good for work, job-seekers must also consider quality of life, so we gathered data relating to health spending, cost of living, and average disposable income.
Finally, because we believe that a location can only be considered good for jobs if it caters to all people equally, we included statistics on the gender wage gap, gender equality and legislation, and women’s opportunities for career progression. The final index paints a picture of those cities which not only excelled in job offerings pre-coronavirus, but also those where the response to the pandemic has meant that their economy can continue to thrive in these uncertain times.
-
 GDP Annual Growth Rate (2013-2018)
 -
 Youth Opportunities*
 -
 Latest Unemployment Rate
 -
 Projected Change in Unemployment Rate 2019-2020 (Percentage Points)
 -
 COVID-19 Estimated Impact on Economy
-
 Workers' Rights
 -
 Parental Leave
 -
 Government Effectiveness*
 -
 Immigration Rates and Openness*
-
 Healthcare Spending*
 -
 Cost of Living
 -
 Disposable Income*
-
 Gender Wage Gap
 -
 Women's Rights & Equality
 -
 Women in Leadership Roles
| Economics | Government Policies | Quality of Life | Gender Equality | |||||||||||||||
|---|---|---|---|---|---|---|---|---|---|---|---|---|---|---|---|---|---|---|
| # | City | Country | Total | |||||||||||||||
| 1 | Singapore | Singapore | 2.43% | 92.70 | 2.40% | 0.20 | 82.81 | 68.21 | 56.68 | 92.78 | 91.80 | 95.27 | 19.80 | 96.29 | 100.00 | 64.92 | 98.58 | 100.00 |
| 2 | Copenhagen | Denmark | 1.73% | 89.70 | 5.10% | 1.47 | 80.95 | 100.00 | 77.29 | 94.80 | 93.46 | 94.40 | 81.07 | 79.05 | 96.12 | 100.00 | 96.34 | 95.16 |
| 3 | Helsinki | Finland | 0.57% | 85.60 | 11.00% | 1.55 | 82.29 | 91.51 | 100.00 | 97.97 | 93.25 | 86.11 | 88.55 | 76.99 | 96.12 | 92.44 | 100.00 | 90.50 |
| 4 | Oslo | Norway | 1.41% | 87.70 | 3.90% | 9.27 | 55.03 | 92.57 | 89.96 | 98.65 | 92.07 | 93.99 | 63.81 | 83.80 | 98.92 | 99.18 | 98.09 | 89.14 |
| 5 | Dubai | UAE | -2.99% | 93.80 | 0.50% | Unavailable | 77.53 | 10.00 | 40.43 | 50.66 | 98.89 | 100.00 | 10.00 | 95.62 | 10.00 | 10.00 | 96.52 | 85.18 |
| 6 | Gothenburg | Sweden | 2.19% | 84.80 | 8.80% | 3.30 | 65.87 | 78.77 | 82.94 | 95.43 | 95.40 | 93.54 | 91.23 | 76.59 | 98.16 | 99.81 | 95.78 | 81.18 |
| 7 | Malmö | Sweden | 1.69% | 80.80 | 13.60% | 3.30 | 65.87 | 78.77 | 82.94 | 95.43 | 92.27 | 96.08 | 96.52 | 78.78 | 98.16 | 99.81 | 95.78 | 77.95 |
| 8 | San Francisco | USA | 4.58% | 95.50 | 3.50% | 6.69 | 69.85 | 45.91 | 56.38 | 76.52 | 91.84 | 33.37 | 38.88 | 100.00 | 93.36 | 75.28 | 94.01 | 77.30 |
| 9 | Munich | Germany | 1.50% | 92.70 | 3.70% | 0.73 | 77.97 | 89.39 | 82.02 | 86.66 | 94.90 | 90.28 | 72.02 | 85.93 | 94.79 | 88.33 | 90.76 | 74.94 |
| 10 | Geneva | Switzerland | 0.29% | 84.70 | 4.50% | 0.42 | 78.56 | 70.05 | 53.27 | 100.00 | 94.67 | 21.84 | 68.95 | 86.19 | 95.69 | 96.82 | 94.92 | 72.78 |
| 11 | Zurich | Switzerland | 0.79% | 90.70 | 2.80% | 0.42 | 78.64 | 70.05 | 53.27 | 100.00 | 89.29 | 31.55 | 71.31 | 90.09 | 95.69 | 96.82 | 94.92 | 72.62 |
| 12 | Hong Kong | HKSAR | 2.07% | 90.60 | 4.20% | 1.51 | 91.68 | 33.35 | 48.69 | 85.99 | 80.87 | 98.24 | 23.49 | 85.69 | 98.35 | 65.52 | 85.17 | 69.10 |
| 13 | Stuttgart | Germany | 1.89% | 90.90 | 4.40% | 0.73 | 77.87 | 89.39 | 82.02 | 86.66 | 95.53 | 88.14 | 83.88 | 83.27 | 94.79 | 88.33 | 90.76 | 68.95 |
| 14 | Dresden | Germany | 2.52% | 90.80 | 5.50% | 0.73 | 77.87 | 89.39 | 82.02 | 86.66 | 93.02 | 82.49 | 95.68 | 78.29 | 94.79 | 88.33 | 90.76 | 68.91 |
| 15 | Los Angeles | USA | 3.40% | 92.10 | 5.70% | 6.69 | 69.85 | 45.91 | 56.38 | 76.52 | 98.88 | 33.37 | 69.77 | 93.20 | 93.36 | 75.28 | 94.01 | 68.22 |
| 16 | Seoul | South Korea | 3.34% | 87.50 | 4.50% | 0.72 | 100.00 | 24.86 | 52.36 | 63.21 | 72.97 | 89.41 | 59.11 | 82.03 | 81.50 | 71.57 | 71.06 | 67.36 |
| 17 | New York | USA | 2.18% | 95.00 | 4.00% | 6.69 | 70.79 | 45.47 | 64.15 | 76.52 | 97.49 | 37.28 | 44.02 | 96.37 | 93.36 | 75.28 | 94.01 | 66.40 |
| 18 | Stockholm | Sweden | 1.05% | 85.00 | 6.80% | 3.30 | 67.58 | 78.77 | 82.94 | 95.43 | 93.16 | 95.04 | 79.22 | 79.84 | 98.16 | 99.81 | 95.78 | 66.13 |
| 19 | Frankfurt | Germany | 1.18% | 90.30 | 5.20% | 0.73 | 77.87 | 89.39 | 82.02 | 86.66 | 95.66 | 85.33 | 77.99 | 82.95 | 94.79 | 88.33 | 90.76 | 64.88 |
| 20 | Tokyo | Japan | 0.01% | 94.10 | 2.60% | 0.64 | 90.34 | 73.52 | 91.60 | 81.06 | 23.30 | 92.61 | 68.88 | 82.07 | 86.30 | 62.57 | 79.14 | 64.81 |
| 21 | San Diego | USA | 2.33% | 89.90 | 4.10% | 6.69 | 69.85 | 45.91 | 56.38 | 76.52 | 98.88 | 33.37 | 80.24 | 95.01 | 93.36 | 75.28 | 94.01 | 64.36 |
| 22 | Berlin | Germany | 2.38% | 89.20 | 7.90% | 0.73 | 78.04 | 89.39 | 82.02 | 86.66 | 95.52 | 83.45 | 85.53 | 79.95 | 94.79 | 88.33 | 90.76 | 64.14 |
| 23 | Graz | Austria | 1.10% | 92.10 | 3.20% | 0.98 | 76.48 | 85.14 | 82.58 | 85.81 | 87.99 | 90.44 | 100.00 | 76.52 | 86.30 | 92.82 | 86.12 | 63.23 |
| 24 | Eindhoven | Netherlands | 3.10% | 91.80 | 3.10% | 3.11 | 67.98 | 85.14 | 56.05 | 95.58 | 89.49 | 91.69 | 85.82 | 80.04 | 93.36 | 95.81 | 94.01 | 62.85 |
| 25 | Basel | Switzerland | 1.55% | 88.50 | 3.50% | 0.42 | 78.56 | 70.05 | 53.27 | 100.00 | 88.22 | 22.21 | 71.12 | 86.11 | 95.69 | 96.82 | 94.92 | 62.28 |
| 26 | Bratislava | Slovakia | 1.78% | 92.90 | 2.90% | 2.24 | 79.50 | 89.05 | 99.30 | 53.80 | 61.20 | 99.83 | 77.99 | 77.63 | 91.28 | 59.85 | 77.04 | 61.70 |
| 27 | Amsterdam | Netherlands | 2.75% | 91.60 | 3.30% | 3.11 | 66.35 | 85.14 | 56.05 | 95.58 | 89.49 | 92.59 | 62.91 | 81.20 | 93.36 | 95.81 | 94.01 | 61.70 |
| 28 | Leipzig | Germany | 1.64% | 90.70 | 6.30% | 0.73 | 77.87 | 89.39 | 82.02 | 86.66 | 80.85 | 84.54 | 99.84 | 73.41 | 94.79 | 88.33 | 90.76 | 60.82 |
| 29 | Utrecht | Netherlands | 1.51% | 92.10 | 2.70% | 3.11 | 66.35 | 85.14 | 56.05 | 95.58 | 93.76 | 92.59 | 77.48 | 78.74 | 93.36 | 95.81 | 94.01 | 59.75 |
| 30 | Tallinn | Estonia | 3.59% | 89.60 | 3.30% | 1.57 | 77.54 | 65.03 | 99.77 | 75.40 | 96.76 | 92.35 | 82.97 | 66.45 | 88.95 | 84.22 | 96.97 | 59.73 |
| 31 | Osaka | Japan | 0.90% | 92.00 | 3.10% | 0.64 | 90.34 | 73.52 | 91.60 | 81.06 | 10.00 | 89.11 | 86.74 | 76.94 | 86.30 | 62.57 | 79.14 | 58.11 |
| 32 | Dublin | Ireland | 10.62% | 87.50 | 4.50% | 7.12 | 36.68 | 89.05 | 64.36 | 83.44 | 89.76 | 89.11 | 66.09 | 81.02 | 93.36 | 85.88 | 89.89 | 57.58 |
| 33 | Linz | Austria | 1.07% | 92.30 | 2.40% | 0.98 | 77.05 | 85.14 | 82.58 | 85.81 | 88.62 | 90.71 | 92.27 | 77.17 | 86.30 | 92.82 | 86.12 | 57.24 |
| 34 | London | UK | 1.58% | 100.00 | 4.50% | 1.00 | 75.80 | 53.41 | 72.81 | 79.20 | 97.66 | 99.52 | 56.58 | 86.38 | 87.67 | 87.29 | 88.98 | 56.76 |
| 35 | Vienna | Austria | 0.15% | 82.40 | 8.60% | 0.98 | 77.03 | 85.14 | 82.58 | 85.81 | 81.19 | 89.67 | 93.12 | 76.24 | 86.30 | 92.82 | 86.12 | 55.40 |
| 36 | Dusseldorf | Germany | 1.05% | 90.80 | 6.60% | 0.73 | 77.97 | 89.39 | 82.02 | 86.66 | 88.12 | 88.33 | 85.84 | 81.94 | 94.79 | 88.33 | 90.76 | 53.95 |
| 37 | Seattle | USA | 3.06% | 88.80 | 5.40% | 6.69 | 70.79 | 45.39 | 10.00 | 76.52 | 91.28 | 34.17 | 69.13 | 96.25 | 93.36 | 75.28 | 94.01 | 53.68 |
| 38 | Calgary | Canada | 1.92% | 87.40 | 8.60% | 1.81 | 77.26 | 58.71 | 77.29 | 91.22 | 95.13 | 88.57 | 88.98 | 83.84 | 94.33 | 91.15 | 94.01 | 53.66 |
| 39 | Hanover | Germany | 1.67% | 90.70 | 6.50% | 0.73 | 77.87 | 89.39 | 82.02 | 86.66 | 87.38 | 84.81 | 91.60 | 79.81 | 94.79 | 88.33 | 90.76 | 53.04 |
| 40 | Ottawa | Canada | 1.63% | 87.30 | 4.90% | 1.81 | 77.26 | 58.71 | 77.29 | 91.22 | 100.00 | 86.35 | 84.91 | 81.27 | 94.33 | 91.15 | 94.01 | 52.04 |
| 41 | Las Vegas | USA | 2.09% | 89.80 | 6.70% | 6.69 | 69.85 | 43.54 | 10.00 | 76.52 | 96.70 | 15.54 | 94.03 | 88.08 | 93.36 | 75.28 | 94.01 | 51.18 |
| 42 | Hamburg | Germany | 0.37% | 89.70 | 6.30% | 0.73 | 77.97 | 89.39 | 82.02 | 86.66 | 88.89 | 87.28 | 79.70 | 82.22 | 94.79 | 88.33 | 90.76 | 50.54 |
| 43 | Cologne | Germany | 2.15% | 90.60 | 7.80% | 0.73 | 77.97 | 89.39 | 82.02 | 86.66 | 91.12 | 85.50 | 83.71 | 79.65 | 94.79 | 88.33 | 90.76 | 50.51 |
| 44 | Rotterdam | Netherlands | 1.66% | 89.60 | 4.00% | 3.11 | 66.35 | 85.14 | 56.05 | 95.58 | 89.49 | 91.54 | 81.47 | 77.89 | 93.36 | 95.81 | 94.01 | 49.22 |
| 45 | Dallas | USA | 1.76% | 90.10 | 4.30% | 6.69 | 69.85 | 43.69 | 10.00 | 76.52 | 92.11 | 19.24 | 95.75 | 91.62 | 93.36 | 75.28 | 94.01 | 48.41 |
| 46 | Boston | USA | 2.37% | 92.70 | 3.00% | 6.69 | 69.85 | 45.75 | 10.00 | 76.52 | 86.91 | 40.98 | 63.95 | 95.81 | 93.36 | 75.28 | 94.01 | 47.76 |
| 47 | Minneapolis | USA | 1.64% | 95.10 | 3.40% | 6.69 | 69.85 | 45.06 | 10.00 | 76.52 | 93.54 | 26.08 | 88.89 | 91.49 | 93.36 | 75.28 | 94.01 | 47.18 |
| 48 | Perth | Australia | -1.48% | 85.00 | 6.00% | 2.44 | 74.13 | 58.71 | 59.59 | 90.80 | 98.94 | 81.63 | 90.65 | 83.24 | 89.56 | 86.68 | 92.84 | 46.32 |
| 49 | Budapest | Hungary | 3.15% | 88.70 | 2.90% | 1.98 | 86.59 | 53.41 | 98.95 | 44.71 | 55.67 | 89.27 | 70.99 | 64.75 | 91.28 | 57.85 | 50.61 | 45.96 |
| 50 | Bordeaux | France | 2.24% | 82.00 | 7.70% | 1.95 | 71.29 | 73.52 | 82.94 | 70.59 | 77.47 | 88.90 | 93.15 | 74.63 | 94.33 | 97.83 | 76.80 | 44.97 |
| 51 | Atlanta | USA | 2.47% | 89.60 | 4.20% | 6.69 | 69.85 | 42.51 | 10.00 | 76.52 | 89.98 | 10.00 | 94.70 | 90.52 | 93.36 | 75.28 | 94.01 | 44.82 |
| 52 | Sydney | Australia | 1.24% | 90.20 | 5.30% | 2.44 | 74.86 | 58.71 | 59.59 | 90.80 | 97.92 | 81.44 | 78.49 | 85.43 | 89.56 | 86.68 | 92.84 | 43.77 |
| 53 | Vancouver | Canada | 2.59% | 90.70 | 5.30% | 1.81 | 77.26 | 58.71 | 77.29 | 91.22 | 92.97 | 87.68 | 75.80 | 82.36 | 94.33 | 91.15 | 94.01 | 43.60 |
| 54 | Toronto | Canada | 1.77% | 89.70 | 6.00% | 1.81 | 77.26 | 58.71 | 77.29 | 91.22 | 96.99 | 86.35 | 75.16 | 80.44 | 94.33 | 91.15 | 94.01 | 42.19 |
| 55 | Ghent | Belgium | 1.72% | 83.70 | 2.90% | 1.94 | 70.78 | 73.52 | 77.14 | 73.45 | 76.44 | 79.99 | 97.03 | 75.18 | 93.36 | 97.19 | 87.74 | 40.14 |
| 56 | Brno | Czechia | 2.62% | 91.30 | 3.90% | 5.50 | 61.21 | 67.15 | 91.60 | 65.88 | 72.07 | 95.44 | 93.79 | 66.16 | 91.28 | 85.12 | 88.85 | 39.83 |
| 57 | Miami | USA | 3.15% | 90.10 | 4.00% | 6.69 | 70.79 | 43.26 | 10.00 | 76.52 | 93.14 | 18.02 | 76.47 | 88.20 | 93.36 | 75.28 | 94.01 | 39.70 |
| 58 | Montreal | Canada | 1.43% | 89.40 | 6.40% | 1.81 | 77.26 | 58.71 | 77.29 | 91.22 | 93.56 | 83.66 | 91.71 | 77.59 | 94.33 | 91.15 | 94.01 | 39.66 |
| 59 | Washington | USA | 1.25% | 92.40 | 3.30% | 6.69 | 69.85 | 45.89 | 38.63 | 76.52 | 90.63 | 27.32 | 61.58 | 93.93 | 93.36 | 75.28 | 94.01 | 39.05 |
| 60 | Lille | France | 0.87% | 70.40 | 10.50% | 1.95 | 71.29 | 73.52 | 82.94 | 70.59 | 80.11 | 86.85 | 92.56 | 72.26 | 94.33 | 97.83 | 76.80 | 38.79 |
| 61 | Houston | USA | -1.45% | 90.00 | 5.10% | 6.69 | 69.85 | 43.69 | 10.00 | 76.52 | 87.42 | 19.24 | 93.06 | 90.53 | 93.36 | 75.28 | 94.01 | 38.21 |
| 62 | Marseille | France | 0.90% | 78.00 | 9.60% | 1.95 | 71.29 | 73.52 | 82.94 | 70.59 | 86.79 | 89.40 | 89.35 | 71.57 | 94.33 | 97.83 | 76.80 | 37.98 |
| 63 | Prague | Czechia | 3.39% | 92.00 | 2.00% | 5.50 | 62.99 | 67.15 | 91.60 | 65.88 | 79.98 | 98.22 | 79.42 | 73.20 | 91.28 | 85.12 | 88.85 | 37.84 |
| 64 | Glasgow | UK | 1.46% | 88.80 | 3.70% | 1.00 | 75.80 | 53.41 | 72.81 | 79.20 | 95.76 | 96.08 | 93.84 | 76.53 | 87.67 | 87.29 | 88.98 | 37.05 |
| 65 | Liverpool | UK | 1.43% | 86.70 | 4.30% | 1.00 | 75.80 | 53.41 | 72.81 | 79.20 | 96.12 | 95.31 | 93.61 | 74.20 | 87.67 | 87.29 | 88.98 | 36.97 |
| 66 | Portland | USA | 1.89% | 92.50 | 3.50% | 6.69 | 69.85 | 45.58 | 10.00 | 76.52 | 94.18 | 16.24 | 83.35 | 88.54 | 93.36 | 75.28 | 94.01 | 36.32 |
| 67 | Cleveland | USA | 2.11% | 88.60 | 7.30% | 6.69 | 69.85 | 44.54 | 10.00 | 76.52 | 82.20 | 14.46 | 96.40 | 87.15 | 93.36 | 75.28 | 94.01 | 36.05 |
| 68 | Paris | France | 1.45% | 84.00 | 7.10% | 1.95 | 73.16 | 73.52 | 82.94 | 70.59 | 78.70 | 92.07 | 65.98 | 80.28 | 94.33 | 97.83 | 76.80 | 35.82 |
| 69 | Chicago | USA | 2.22% | 89.80 | 4.80% | 6.69 | 69.85 | 44.98 | 10.00 | 76.52 | 86.24 | 26.11 | 84.33 | 91.42 | 93.36 | 75.28 | 94.01 | 35.57 |
| 70 | Quebec | Canada | 1.40% | 90.90 | 5.90% | 1.81 | 77.26 | 58.71 | 77.29 | 91.22 | 90.94 | 83.66 | 93.08 | 75.27 | 94.33 | 91.15 | 94.01 | 35.47 |
| 71 | Brussels | Belgium | 0.28% | 67.80 | 11.80% | 1.94 | 68.92 | 73.52 | 77.14 | 73.45 | 91.22 | 75.51 | 90.50 | 76.51 | 93.36 | 97.19 | 87.74 | 35.41 |
| 72 | Ljubljana | Slovenia | 3.07% | 88.80 | 7.00% | 4.40 | 68.74 | 64.25 | 78.35 | 64.43 | 93.83 | 89.09 | 85.45 | 67.94 | 99.65 | 89.17 | 90.52 | 34.78 |
| 73 | Lyon | France | 1.71% | 81.60 | 7.20% | 1.95 | 71.29 | 73.52 | 82.94 | 70.59 | 77.75 | 89.81 | 84.96 | 76.67 | 94.33 | 97.83 | 76.80 | 34.57 |
| 74 | Denver | USA | 1.70% | 92.60 | 4.60% | 6.69 | 69.85 | 44.66 | 10.00 | 76.52 | 90.11 | 28.42 | 81.85 | 92.01 | 93.36 | 75.28 | 94.01 | 34.31 |
| 75 | Nice | France | 0.85% | 78.00 | 8.50% | 1.95 | 71.29 | 73.52 | 82.94 | 70.59 | 80.36 | 89.40 | 84.97 | 74.55 | 94.33 | 97.83 | 76.80 | 33.78 |
| 76 | Krakow | Poland | 4.99% | 86.90 | 2.00% | 6.64 | 78.58 | 51.29 | 78.00 | 51.92 | 65.95 | 77.61 | 76.89 | 65.33 | 92.86 | 73.91 | 78.92 | 33.76 |
| 77 | Pittsburgh | USA | 1.59% | 89.60 | 6.20% | 6.69 | 69.85 | 44.54 | 10.00 | 76.52 | 83.06 | 26.00 | 89.80 | 89.86 | 93.36 | 75.28 | 94.01 | 33.27 |
| 78 | Adelaide | Australia | 0.26% | 85.60 | 6.40% | 2.44 | 73.45 | 58.71 | 59.59 | 90.80 | 93.22 | 76.96 | 97.60 | 81.10 | 89.56 | 86.68 | 92.84 | 32.94 |
| 79 | Antwerp | Belgium | 1.26% | 80.00 | 2.90% | 1.94 | 70.78 | 73.52 | 77.14 | 73.45 | 81.59 | 79.99 | 89.98 | 76.96 | 93.36 | 97.19 | 87.74 | 32.87 |
| 80 | Melbourne | Australia | 0.72% | 88.40 | 5.70% | 2.44 | 74.59 | 58.71 | 59.59 | 90.80 | 94.52 | 76.98 | 87.01 | 82.14 | 89.56 | 86.68 | 92.84 | 30.44 |
| 81 | Cardiff | UK | 1.42% | 86.80 | 3.70% | 1.00 | 75.80 | 53.41 | 72.81 | 79.20 | 95.54 | 94.54 | 88.71 | 74.20 | 87.67 | 87.29 | 88.98 | 30.13 |
| 82 | Brisbane | Australia | 1.48% | 86.60 | 6.50% | 2.44 | 73.34 | 58.71 | 59.59 | 90.80 | 93.06 | 77.24 | 89.25 | 82.70 | 89.56 | 86.68 | 92.84 | 28.25 |
| 83 | Bristol | UK | 1.52% | 90.10 | 3.10% | 1.00 | 75.80 | 53.41 | 72.81 | 79.20 | 95.93 | 96.47 | 78.92 | 78.22 | 87.67 | 87.29 | 88.98 | 27.99 |
| 84 | Porto | Portugal | 2.95% | 81.40 | 7.10% | 7.48 | 41.26 | 65.03 | 77.43 | 70.56 | 79.86 | 75.08 | 91.06 | 57.31 | 96.12 | 89.44 | 81.23 | 27.67 |
| 85 | Leeds | UK | 1.37% | 89.90 | 4.70% | 1.00 | 75.80 | 53.41 | 72.81 | 79.20 | 96.12 | 94.81 | 83.22 | 75.24 | 87.67 | 87.29 | 88.98 | 26.77 |
| 86 | Warsaw | Poland | 3.84% | 89.70 | 1.30% | 6.64 | 78.58 | 51.29 | 78.00 | 51.92 | 77.78 | 87.21 | 65.62 | 73.65 | 92.86 | 73.91 | 78.92 | 26.56 |
| 87 | Detroit | USA | 2.19% | 89.10 | 4.90% | 6.69 | 69.85 | 43.37 | 10.00 | 76.52 | 88.82 | 13.18 | 94.12 | 83.33 | 93.36 | 75.28 | 94.01 | 25.22 |
| 88 | Philadelphia | USA | 1.65% | 90.40 | 5.10% | 6.69 | 69.85 | 44.54 | 10.00 | 76.52 | 85.35 | 26.00 | 81.58 | 88.48 | 93.36 | 75.28 | 94.01 | 24.19 |
| 89 | Birmingham | UK | 1.88% | 84.60 | 4.80% | 1.00 | 75.80 | 53.41 | 72.81 | 79.20 | 92.96 | 95.35 | 86.49 | 73.95 | 87.67 | 87.29 | 88.98 | 24.10 |
| 90 | Manchester | UK | 1.35% | 86.60 | 4.30% | 1.00 | 75.80 | 53.41 | 72.81 | 79.20 | 92.39 | 95.31 | 86.11 | 75.73 | 87.67 | 87.79 | 88.98 | 21.40 |
| 91 | Barcelona | Spain | 2.76% | 73.80 | 10.70% | 6.70 | 10.00 | 60.84 | 57.80 | 58.67 | 67.36 | 89.28 | 73.17 | 74.49 | 93.36 | 93.45 | 76.04 | 19.10 |
| 92 | Edinburgh | UK | 1.16% | 88.60 | 3.70% | 1.00 | 75.80 | 53.41 | 72.81 | 79.20 | 91.95 | 96.08 | 83.25 | 76.66 | 87.67 | 87.29 | 88.98 | 17.79 |
| 93 | Milan | Italy | 0.85% | 79.90 | 6.00% | 2.75 | 55.77 | 59.67 | 75.82 | 45.66 | 70.49 | 93.32 | 67.40 | 76.61 | 87.67 | 92.18 | 10.00 | 14.38 |
| 94 | Madrid | Spain | 1.77% | 67.50 | 10.60% | 6.70 | 48.57 | 60.84 | 57.80 | 58.67 | 83.52 | 90.91 | 72.28 | 77.63 | 93.36 | 93.45 | 76.04 | 14.31 |
| 95 | Lisbon | Portugal | 1.46% | 80.20 | 7.10% | 7.48 | 41.26 | 65.03 | 77.43 | 70.56 | 86.20 | 82.75 | 85.45 | 66.18 | 96.12 | 89.44 | 81.23 | 13.87 |
| 96 | Monterrey | Mexico | 2.45% | 91.30 | 3.90% | 2.06 | 76.88 | 25.87 | 51.99 | 10.00 | 86.53 | 74.65 | 72.15 | 43.66 | 79.59 | 48.23 | 57.03 | 13.45 |
| 97 | Rome | Italy | -0.62% | 55.10 | 10.10% | 2.75 | 49.19 | 59.67 | 75.82 | 45.66 | 70.36 | 90.88 | 74.93 | 72.20 | 87.67 | 92.18 | 10.00 | 12.04 |
| 98 | Mexico City | Mexico | 1.39% | 88.80 | 4.80% | 2.06 | 77.05 | 25.87 | 51.99 | 10.00 | 71.00 | 60.21 | 75.24 | 10.00 | 79.59 | 48.23 | 57.03 | 7.57 |
| 99 | Athens | Greece | 1.07% | 10.00 | 15.70% | 5.03 | 51.86 | 19.55 | 73.88 | 36.68 | 76.04 | 83.67 | 77.53 | 59.91 | 93.36 | 70.44 | 72.35 | 1.38 |
| 100 | Santiago | Chile | 0.53% | 86.50 | 8.60% | 2.39 | 72.50 | 44.97 | 67.60 | 66.78 | 87.09 | 43.19 | 75.93 | 38.69 | 87.67 | 65.06 | 70.38 | 1.00 |
This study uses data and statistics to evaluate the best cities to find a job. Each city is analysed against 15 factors relating to economics, governmental policies, quality of life, and gender equality. To select the cities for the study, OECD nations were analyzed according to their available business infrastructure statistics, as well as those cities which are considered popular for economic, educational, or aspirations opportunities, in order to determine a final list of 100 cities. This study utilises metropolitan areas as defined by OECD.
The research for this study began in early 2020 before the COVID-19 pandemic, so every effort has been made in this study to offer data which is relevant both to the career prospects of a city in recent history, and how current international affairs may have impacted economic prospects for job seekers.
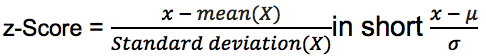
Factors consist of one or more indicators which were scored and averaged. The equation for scores is as follows:
For columns where a low value is better, the score is inverted such that a high score is always better:

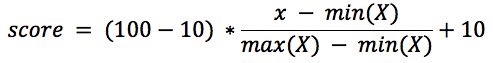
Scores are normalized such that 10 equals the lowest value in the final dataset and 100 the highest value in the final dataset. Therefore, the higher the score, the better the city ranks for that factor in comparison to the other cities in the index. For example, a score of 100 for “COVID-19 Estimated Impact on economy” indicates that the city will endure a low economic impact related to COVID-19, relative to other cities in the ranking.
The equation for normalization is as follows:
All factors are expressed as scores out of 100, except for the following three factors:
-
GDP Annual Growth Rate 2013-2018 (%)
-
Latest Unemployment Rate (%)
-
Projected Change in Unemployment Rate 2019-2020 (Percentage Points)
When calculating the total score for each city, a weighted average is taken of all factor scores, where each factor score has been capped at the median of the factor–that is, scores lower than the median have been treated as if they are the same as the median score.
By capping the scores at the median, individual weaknesses are limited in their effect on the total score. This allows cities that excel in multiple areas to rise to the top of the rankings, while cities that excel in fewer areas rank towards the bottom of the ranking.
In this study, all prices and costs are converted to Purchase Power Parities according to the exchange rate of the International Monetary Fund (IMF). According to the IMF, this is the rate at which the currency of one country would have to be converted into that of another country to buy the same amount of goods and services in each country. The PPP-exchange rate is more stable over time in comparison to a market exchange rate (eg. USD) and it takes into account local conditions (eg. local goods, services and wages).
GDP/Capita compound annual growth rate over the period 2013 - 2018.
- “OECD Metropolitan areas” database, dimensions:
- Indicator: “GDP_PC: GDP per capita (US$)”, expressed in US$, constant prices and constant PPPs, OECD base year (2010).
- As most values in this database are 2016 or 2015 estimates, data from the metropolitan areas was extrapolated to 2018 using GDP growth rates in OECD Regional Economy database. Dimensions: Indicator “GDP”, Measurement: “PC_REAL_PPP: USD per head, constant prices, constant PPP, base year 2010”
Formula Five-year compound annual growth rate:
(GDP per capita 2018/GDP per capita2013)(1/5)
- OECD “Metropolitan areas” database;
https://stats.oecd.org/Index.aspx?Datasetcode=CITIES - OECD “Regional Labour” database;
https://stats.oecd.org/Index.aspx?Datasetcode=REGION_ECONOM - Numbers for non-OECD cities were obtained from Worldbank and local authorities.
Youth employment rate and the number of startups.
- Youth Employment rate (15-24 years)
- Number of startups
- Number of startups per 1 million inhabitants
- OECD “Regional Labour” database;
https://stats.oecd.org/Index.aspx?Datasetcode=REGION_LABOUR# - OECD “Metropolitan areas” database (Population)
https://stats.oecd.org/Index.aspx?DataSetCode=CITIES# - Crunchbase.com
- Angels.co
Latest available unemployment rate for the metropolitan area or region.
- In order to ensure a certain level of comparability, we excluded data from April, therefore most numbers reflect the status of March 2020.
- Due to the difference in reporting dates, this factor is not part of the Total score.
- The majority of figures were collected on a metropolitan level (egÎle-de-France instead of Paris 75). When data on a metropolitan level was unavailable, regional data was taken to represent the city (eg Flanders instead of Ghent, Belgium).
- Local offices of statistics, local authorities
A comparison based on a projection of the unemployment rate.
- Based on the “World Economic Outlook Report” for April 2020 by the International Monetary Fund (IMF), the projected unemployment rate for 2020 was compared to the unemployment rate of 2019; both numbers come from the IMF report.
- The change of the unemployment rate over a one-year period, expressed in percentage points, eg. 3 would indicate an increase of the unemployment rate by 3 percent whereas -3 would describe a decrease of 3 percent.
- This data is on a country level.
- There were no numbers available for the United Arab Emirates.
- As the projected change of the unemployment rate is already part of the 'COVID-19 Estimated Impact on Economy'-Score, this column does not contribute to the total score.
- International Monetary Fund
The score describes the impact that COVID-19 may have on the economy due to measures implemented, COVID-19-cases, COVID-19-deaths as well as an IMF outlook on the economy.
- The reasoning behind this score is the following: The best outcome for an economy would be a low number of COVID-19 measures, a low number of COVID-19 cases and a positive outlook on GDP and unemployment numbers.
- It consists of the following indicators:
- Number of COVID-19 measures related to the economy. The score for these measures was inverted so that a high score means a low number of measures:
- Limit public gatherings
- Border closure
- Schools closure
- Limit product imports/exports
- Border checks
- International flights suspension
- Domestic travel restrictions
- Partial lockdown
- Checkpoints within the country
- Public services closure
- Full lockdown
- Visa restrictions
- limit public gatherings
- Complete border closure
- Curfews
- Number of Economic measures (like aid programmes).
The number of measures refers to the ACAPS database of 05.05.2020. - Total number of COVID-19-Cases per million inhabitants.
All numbers related to COVID-19 are correct as of 07.05.2020. - Days since the total confirmed cases per million people reached 1.
All numbers related to COVID-19 are correct as of 07.05.2020. - Total Number of COVID-19 related deaths.
All numbers related to COVID-19 are correct as of 07.05.2020. - IMF Outlook on unemployment in 2020 relative to 2019. As the score reflects the projected change in unemployment from 2019 to 2020, countries that enjoyed low unemployment in 2019 may therefore score lower than countries that already struggled with high unemployment, assuming both countries arrive at the same unemployment rate in 2020.
- IMF Outlook on GDP per capita in 2020 relative to 2019. As the score reflects the projected change in GDP growth from 2019 to 2020, countries that enjoyed high GDP growth in 2019 may therefore score lower than countries that already struggled with low GDP growth rates, assuming both countries arrive at the same GDP growth rate in 2020.
- Number of COVID-19 measures related to the economy. The score for these measures was inverted so that a high score means a low number of measures:
- The data was collected mainly on country level, but some of the COVID-19 measures are on a regional level – these differences were taken into account, so that the scores for cities within the same country may differ.
- In addition to the seven indicators above, poll data was included for Germany, France, Italy, Spain, the UK, and the USA, asking respondents in lockdown to answer a series of questions relating to their experience of the COVID-19 pandemic.
- The data from the following question was included in the scoring of this factor:
“How has your employment status been affected by the COVID-19 pandemic. Check any that apply”:
My employment situation has not changed at all; I own a small business, which is still open for business; I own a small business, which has been temporarily closed; I owned a small business, which I have had to close permanently; I have entirely lost at least one of my main sources of income; I have entirely lost a source of side-income; I am working reduced hours, receiving NO financial support to compensate for lost income; I am working reduced hours, WITH government or insurance support making up for some of my lost hours; I have been asked by my employer to not work at all, temporarily; but receiving NO financial support to compensate for lost income; I have been asked by my employer to not work at all, temporarily; and WITH government or insurance support making up for some of my lost hours; I am working more now than before the pandemic, but NOT being compensated for the additional hours; I am working more now than before the pandemic, and being COMPENSATED for the additional hours. - For further details of the poll, please get in touch and these can be provided.
- ACAPS, Ourworldindata/European Centre for Disease Prevention, International Monetary Fund
This score compares the legal situation for workers around the world.
- It consists of the following indicators:
- World Justice Project “Rule of Law Index - 2020 Insights”: “Fundamental labor rights are effectively guaranteed”.
- Oxfam “The best and worst states to work in in America 2018”: “Worker Protection”, “Right to Organize”. This is a ranking which only includes the US; it was taken into account to differentiate between the cities in the US.
- International Trade Union Confederation “2019 The World’s Worst Countries for Workers”: Rating (5=”No guarantee of rights due to the breakdown of the law”, 1=”Sporadic violations of rights”).
- The data is provided mainly on a country level; except for the Oxfam ranking which is on (US) state level.
- WJP Fundamental labor rights
- OXFAM Worker Protection Policies (only for USA)
- ITUC Worst Countries for Workers
The total number of days that are granted as paid maternity and parental leave.
- OECD “Family database”, dimensions:
- Indicator: “Length of paid maternal and parental”, unit: “weeks”
- Indicator: “Length of paid father-specific leave”, unit: “weeks”
- Age group “Total”
- Unit: “Weeks”
- These two indicators were summed up and multiplied by 7 to obtain the total number of paid days granted for parents.
- The data is provided on a country level and reflects the situation in 2016.
- OECD “Family database”, “Employment: Length of maternity leave, parental leave, and paid father-specific leave”; https://stats.oecd.org/index.aspx?queryid=54760#
- Numbers for non-OECD cities were obtained from local authorities.
The quality of public services and the civil service, and the government's ability to formulate and implement policy.
- While the index is compiled by the World Bank, it is in turn an aggregate of multiple secondary indices, including the Economist Intelligence Unit Riskwire & Democracy Index, the World Economic Forum Global Competitiveness Report, Satisfaction with transportation according to the Gallup World Poll, the Institutional Profiles Database, the Political Risk Services International Country Risk Guide, and Global Insight Business Conditions and Risk Indicators.
- World Bank "World Governance Indicators";
http://info.worldbank.org/governance/wgi/#home
The non-native population as a share of the total population as well as indicators from Nomadslist.
- OECD “Database on Migrants in OECD Regions”, dimensions:
- Indicator: “ALL_T_SH: Share of Foreign-Born Population”
- Place of birth: “Foreign-born”.
- All observations from this database are for the year 2015
- Indicators from Nomadslist:
- English speaking: In order not to privilege English speaking countries in general, countries were only penalized, if they had a lower rating than “okay”.
- Friendly to foreigners.
- Racial tolerance.
- OECD “Database on Migrants in OECD Regions”;
https://stats.oecd.org/Index.aspx?Datasetcode=REGION_MIGRANTS - Nomadslist
Yearly household expenditure on health, as a percentage of disposable income.
- OECD “Final Consumption and financing” database, dimensions:
- TRANSACT - Transaction: “P31CP060 - Health”;
- Measure: “Current prices, millions”,
- Data was converted to PPP per capita.
- Disposable income is described in detail below. The data reflects the situation in 2018.
- OECD “Final Consumption and financing” database;
https://stats.oecd.org/Index.aspx?DataSetCode=SNA_TABLE5# - Numbers for non-OECD cities were obtained from local authorities.
Indicators from Numbeo, Expatistan and Nomadslist. All indicators were converted into Purchase Power Parities. A higher score indicates a lower cost of living.
For Cost of Living, we used the following indicators:
- Cost of living rank
- A single person monthly costs without rent
- Four-person family monthly costs without rent
- Rent Per Month (Average of 1 bedroom, 3 bedrooms, in city centre and outside city centre)
- Buy Apartment Price (Average of 1 bedroom, 3 bedrooms, in city centre, and outside city centre).
- Restaurants (average cost of basic lunchtime menu, combo meal in fast food restaurant, basic dinner out for two in neighborhood pub, dinner for two at an Italian restaurant in the expat area including appetisers, main course, wine and dessert)
- Markets (average cost of chicken breast, milk, eggs, tomatoes, local cheese, apples, potatoes, domestic beer, red table wine, coca-cola, bread, for two people for one day)
- Rent (average cost of monthly rent for big and small furnished apartments in expensive and normal areas, plus utilities for one month)
- Transportation (average cost of gasoline, monthly ticket public and taxi trip on a business day)
- Cost
Per capita wages and other incomes (eg rental income and other investments) minus taxes and social contributions.
- OECD dimensions:
- SNA Classification: “Last SNA classification (SNA 2008 or latest available)”
- Indicator: “INCOME_DISP: Disposable Household Income” Measure: “National currency per head, current prices”,
––>
- OECD “Regional Economy” database;
https://stats.oecd.org/Index.aspx?Datasetcode=REGION_ECONOM
For non-OECD countries.
The quality of public services and the civil service, and the government's ability to formulate and implement policy.
- While the index is compiled by the World Bank, it is in turn an aggregate of multiple secondary indices, including the Economist Intelligence Unit Riskwire & Democracy Index; the World Economic Forum Global Competitiveness Report; Satisfaction with transportation, according to the Gallup World Poll; the Institutional Profiles Database; the Political Risk Services International Country Risk Guide; and Global Insight Business Conditions and Risk Indicators
- World Bank "World Governance Indicators";
http://info.worldbank.org/governance/wgi/#home
The difference in percentages between women's average monthly wages compared to men's average monthly wages.
- Female-to-male ratio (f/m) of indicator “Estimated earned income (PPP, US$)”.
- World Economic Forum “The Global Gender Gap Report 2020”;
http://www3.weforum.org/docs/WEF_GGGR_2020.pdf
A score of ratings of legislative restrictions on women’s rights as well as cultural norms and impediments.
The OECD “Social Institutions & Gender Index” database evaluates social institutions in four main categories with the following:
- Discrimination in the family: Child marriage, Household responsibilities, Divorce, Inheritance.
- Restricted physical integrity: Violence against women, Female genital mutilation, Missing women, Reproductive autonomy.
- Restricted access to productive and financial resources: secure access to land and non/land assets, Secure access to formal financial services, Workplace rights.
- Restricted civil liberties: Citizenship rights, Political voice, Freedom of movement, Access to justice.
- OECD “Gender, Institutions and Development Database (GID-DB) 2019”
https://stats.oecd.org/Index.aspx?QueryId=71075
Response to the survey question: “In your country, to what extent do companies provide women the same opportunities as men to rise to positions of leadership?"
- Indicator “Advancement of women to leadership roles”. It refers to the results of the World Economic Forum “Executive Opinion Survey 2018-2019”, more precisely the question: “In your country, to what extent do companies provide women the same opportunities as men to rise to positions of leadership? (1 = not at all, women have no opportunities to rise to positions of leadership; 7 = extensive, women have equal opportunities of leadership)”.
- World Economic Forum “The Global Gender Gap Report 2020”;
http://www3.weforum.org/docs/WEF_GGGR_2020.pdf
An anonymous poll was conducted by Magmatic Research, and asked those currently experiencing lockdown in France, Germany, Italy, Spain, the UK and the USA questions about the impacts of the COVID-19 pandemic on their lives, including economic status. The poll was conducted via a web panel consisting of respondents representative of the gender and age demographic breakdown of each country and ran between 20 April and 5 May.
- The data from the following question was utilised to support the statement: "on average 50% of respondents had either lost their job entirely, or had their earning capacity reduced in some manner since the start of the pandemic.”
- “How has your employment status been affected by the COVID-19 pandemic? Check any that apply”:
- My employment situation has not changed at all; I own a small business, which is still open for business; I own a small business, which has been temporarily closed; I owned a small business, which I have had to close permanently; I have entirely lost at least one of my main sources of income; I have entirely lost a source of side-income; I am working reduced hours, receiving NO financial support to compensate for lost income; I am working reduced hours, WITH government or insurance support making up for some of my lost hours; I have been asked by my employer to not work at all, temporarily; but receiving NO financial support to compensate for lost income; I have been asked by my employer to not work at all, temporarily; and WITH government or insurance support making up for some of my lost hours; I am working more now than before the pandemic, but NOT being compensated for the additional hours; I am working more now than before the pandemic, and being COMPENSATED for the additional hours.
- If you would like to receive more details about the poll, kindly get in touch with info@magmaticresearch.com.