This course is part of the Power BI for Data Storytelling ExpertTrack
Mastering DAX and Data Visualisation in Power BI
Advance your Power BI skills by mastering DAX and designing compelling data reports that support better business decisions.

Duration
3 weeksWeekly study
3 hours100% online
How it worksIncluded in an ExpertTrack
Course 2 of 4
Mastering DAX and Data Visualisation in Power BI
Master DAX and Power BI to advance as an analyst
DAX is the analytical engine behind Microsoft Power BI, enabling you to create powerful calculations that transform data into actionable insights. On this three-week course, you’ll build the skills to write reliable DAX formulas and create professional, interactive reports that help organisations make informed business decisions.
You’ll begin by exploring DAX syntax, data types, and the difference between calculated columns and measures. As you develop your skills, you’ll apply aggregation, filter, logical, and text functions to solve real-world business challenges, from tracking revenue and profitability to measuring key performance indicators.
Develop advanced DAX and data analysis skills
Next, you’ll learn the advanced DAX techniques used by data analysts and Power BI developers. You’ll explore concepts such as filter context, row context, and the CALCULATE function, gaining the knowledge needed to build accurate, flexible business calculations.
You’ll also learn how to create time intelligence measures for year-on-year comparisons, use iterators to solve more complex analytical problems, and apply performance optimisation techniques to write efficient, production-ready DAX code.
Design interactive Power BI dashboards and reports
Great business intelligence is about more than accurate calculations. You’ll discover how to communicate insights through effective data visualisation by exploring the full Power BI visual library.
You’ll learn how to create engaging, interactive dashboards using bookmarks, tooltips, drill-through, field parameters, and conditional formatting. By the end of the course, you’ll be able to build polished, story-driven Power BI reports that help stakeholders explore data and make confident decisions.
Syllabus
Week 1
Building Business Calculations with DAX


Getting Started with DAX
Begin your DAX journey by exploring its role in Power BI, understanding why it matters for analytics, and preparing to build your first business calculations.

Learning the Foundations of DAX
Explore DAX fundamentals by learning its role in Power BI, understanding syntax and data types, and creating calculations with columns, measures, and core functions.

Creating Business Calculations with DAX
Apply DAX functions to create business calculations, perform filtering and aggregation, build conditional and text-based logic, and analyse trends using time intelligence functions.

DAX: Context and Performance
Deepen your DAX skills by working with tables, filters, row and filter context, and performance techniques to write efficient business calculations.
Week 2
Designing Impactful Data Visualisations

Building Core Visualisation Skills
Build core Power BI visualisation skills by creating cards, slicers, bar, column, line, and combo charts, then formatting them to communicate insights clearly.

Selecting the Right Visual for Every Insight
Choose the right Power BI visual by working with area, pie, donut, scatter, bubble, and dot plot charts, while considering performance and reporting needs.

Designing Insightful Reports
Construct insightful Power BI reports using KPI visuals, maps, tables, matrices, and conditional formatting to present business performance clearly.
Week 3
Interactive Reporting and Data Storytelling

Enhancing Report Interactivity
Leverage custom visuals, treemaps, and filtering techniques to create interactive Power BI reports and explore data dynamically.

Crafting Reports that Tell a Story
Combine report design elements, bookmarks, tooltips, and field parameters to create compelling, interactive Power BI reports.
Prove you're job ready
Highlight the new, job-relevant skills you’ve gained and supplement existing qualifications with a hard-earned, industry-specific digital certificate – plus one for every course within your ExpertTrack.
- Learn the latest in your chosen industry or subject.
- Complete each course and pass assessments.
- Receive certificates validated by the educating organisation.
- Impress employers with learning outcomes you can add to your CV.
- Make your career dreams a reality.
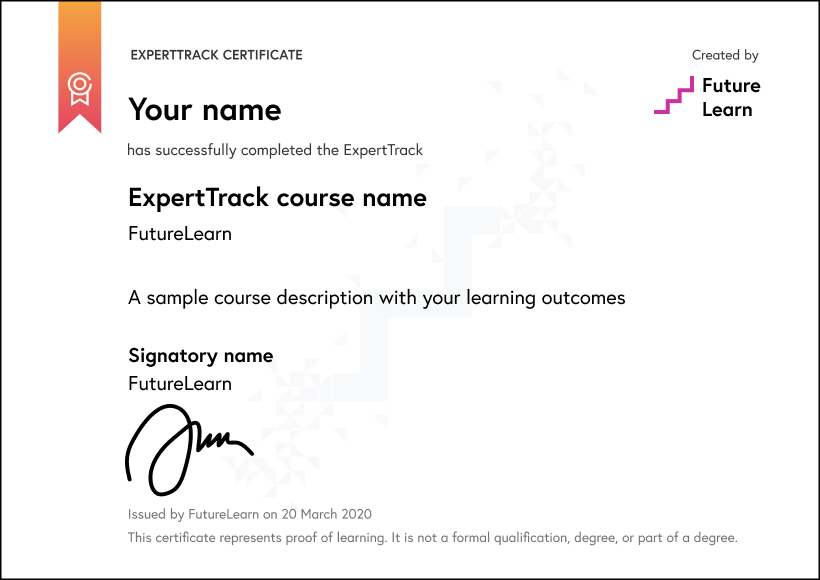
Download a PDF
Learning on this course
On every step of the course you can meet other learners, share your ideas and join in with active discussions in the comments.
What will you achieve?
By the end of the course, you‘ll be able to...
- Apply DAX functions, operators, and business logic to create calculations for analytical reporting.
- Assess row context, filter context, and calculation requirements to develop accurate and efficient DAX formulas.
- Evaluate visualisation types and formatting techniques to communicate business insights effectively.
- Create interactive Power BI reports using filters, bookmarks, tooltips, field parameters, and dynamic visuals.
- Design engaging data stories that combine DAX calculations, effective visualisations, and interactive reporting techniques.
Who is the course for?
This course is designed for data analysts, BI developers, reporting specialists, Excel power users, and business professionals with a working foundation in Power BI.
Prior experience with Power BI Desktop, Power Query, and basic data modelling is recommended. The course is ideal for learners aiming to strengthen their DAX and report design capabilities, progress toward intermediate-level Power BI proficiency, and prepare for roles such as Power BI Developer, BI Analyst, Analytics Consultant, Data Analyst, or Reporting Specialist.
These skills are valuable across finance, banking, retail, healthcare, manufacturing, consulting, and technology, where effective data analysis and clear insight communication are essential.
What software or tools do you need?
No paid software is required for course completion. Learners need Power BI Desktop, which is available free of cost, to practise DAX calculations, create visualisations, and build interactive reports. The required datasets and supporting resources will be provided during the course.
Who will you learn with?

Who developed the course?

Edureka
Edureka is a global online learning platform offering industry-focused training in emerging technologies such as Cloud, AI, GenAI, Data Science, DevOps, and Cybersecurity, helping professionals upskill and advance their careers.

Start learning today - free 2-day trial
After your free trial you can:
- Pay $39 per month to keep learning online
- Have complete control over your subscription; you can cancel any time
- Work at your own pace and set your own deadlines at every stage
- Only pay while you’re learning; the subscription will cancel automatically when you finish
- Complete online assessments to test your knowledge and prove your skills
- Earn digital course certificates and a final award that you can share online, with potential employers, and your professional network
- Keep access to the content of courses you complete even after your subscription ends
Learning on FutureLearn
Your learning, your rules
- Courses are split into weeks, activities, and steps to help you keep track of your learning
- Learn through a mix of bite-sized videos, long- and short-form articles, audio, and practical activities
- Stay motivated by using the Progress page to keep track of your step completion and assessment scores
Join a global classroom
- Experience the power of social learning, and get inspired by an international network of learners
- Share ideas with your peers and course educators on every step of the course
- Join the conversation by reading, @ing, liking, bookmarking, and replying to comments from others
Map your progress
- As you work through the course, use notifications and the Progress page to guide your learning
- Whenever you’re ready, mark each step as complete, you’re in control
- Complete 90% of course steps and all of the assessments to earn your certificate
Want to know more about learning on FutureLearn? Using FutureLearn


