This course is part of the Data Analytics for Decision Making with Tableau ExpertTrack
Applied Tableau Analytics: Calculations and Dynamic Dashboard Development
Take your Tableau skills beyond basic charts to understand how to turn complex data into deeper business insights.

Duration
3 weeksWeekly study
3 hours100% online
How it worksIncluded in an ExpertTrack
Course 2 of 4
Applied Tableau Analytics: Calculations and Dynamic Dashboard Development
Develop advanced Tableau calculations
On this three-week course, you’ll develop your Tableau calculations skills and learn how to apply business logic to your analysis.
You’ll create calculated fields using arithmetic, logical, date, and string functions, while learning how row-level and aggregate calculations work. You’ll use these techniques to build reusable business metrics, including sales growth, profit ratios, contribution analysis, and KPI indicators.
Apply advanced Tableau analytics
Go beyond basic analysis with advanced Tableau techniques that help you answer more complex business questions. You’ll explore table calculations, including running totals, percent of total, moving averages, ranks, and window functions.
You’ll also learn how to use Level of Detail (LOD) expressions, including FIXED, INCLUDE, and EXCLUDE, alongside parameters, trend lines, reference lines, forecasting, clustering, and outlier analysis. These skills will help you create more sophisticated analytical views and uncover meaningful patterns in your data.
Create dynamic Tableau dashboards
Turn your analysis into polished, interactive experiences designed for business audiences. You’ll use filter, highlight, URL, parameter, and set actions to give users greater control over how they explore data.
You’ll also explore dynamic titles, show/hide containers, navigation buttons, guided filters, visual hierarchy, accessibility, and storytelling principles.
By the end of the course, you’ll have the skills to design professional Tableau dashboards that combine analytical depth with effective data visualisation.
Syllabus
Week 1
Tableau Calculations and Business Logic


Welcome to Advanced Tableau Analysis
Prepare for advanced Tableau analysis by exploring the skills and techniques that power deeper business insights. Build the foundation for creating sophisticated analytical solutions.

Build Your First Business Calculations
Create robust business calculations using Tableau's functions, data types, and calculated fields. Develop the confidence to build accurate and reliable analytical logic.

Apply Business Logic and Date Intelligence
Implement business rules with logical functions, conditional calculations, and date intelligence. Transform complex business requirements into meaningful analytical insights.

Analyse Time and Build Business Metrics
Analyse business performance over time by applying date-based calculations and reusable business metrics. Turn time-series data into actionable insights for better decision-making.
Week 2
Analytical Modelling and Advanced Visualisations

Perform Advanced Table Calculations
Apply advanced table calculations to uncover trends, compare performance over time, and generate deeper analytical insights. Build confidence in solving complex business questions with Tableau.

Master Level of Detail Expressions
Develop precise analytical models using Level of Detail (LOD) expressions to control data granularity and aggregation. Unlock deeper insights through flexible and scalable calculations.

Apply Advanced Analytical Techniques
Create advanced visual analyses by combining analytical calculations, dynamic controls, KPIs, and statistical techniques. Transform complex data into meaningful business insights.

Explore Spatial and Predictive Analytics
Explore spatial and predictive analytics to uncover geographic patterns, model future trends, and evaluate business scenarios. Extend your analysis with advanced decision-support techniques.
Week 3
Interactive Dashboards and Visual Storytelling

Build Interactive Dashboards
Create interactive dashboards that encourage users to explore data with confidence. Combine advanced layouts, navigation, and dynamic elements to deliver engaging analytical experiences.

Design Dashboards for Decision-Making
Design decision-focused dashboards by applying advanced interactions, visual hierarchy, and storytelling principles. Build accessible and intuitive experiences that communicate insights with clarity.
Prove you're job ready
Highlight the new, job-relevant skills you’ve gained and supplement existing qualifications with a hard-earned, industry-specific digital certificate – plus one for every course within your ExpertTrack.
- Learn the latest in your chosen industry or subject.
- Complete each course and pass assessments.
- Receive certificates validated by the educating organisation.
- Impress employers with learning outcomes you can add to your CV.
- Make your career dreams a reality.
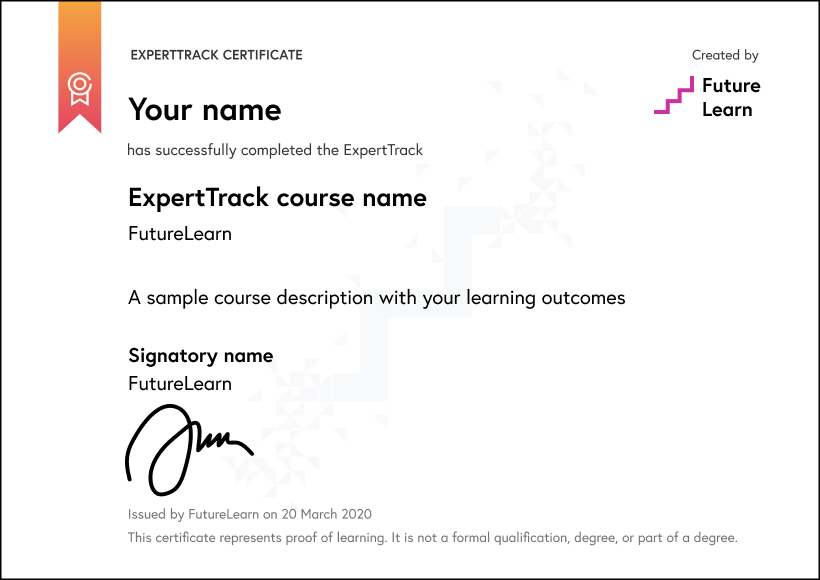
Download a PDF
Learning on this course
On every step of the course you can meet other learners, share your ideas and join in with active discussions in the comments.
What will you achieve?
By the end of the course, you‘ll be able to...
- Apply advanced Tableau calculations and business logic to solve complex analytical requirements.
- Compare table calculations, LOD expressions, parameters, and filters based on analytical context and granularity.
- Assess spatial, statistical, predictive, and comparative techniques to identify patterns and trends.
- Create dynamic dashboards using advanced actions, adaptive layouts, navigation, and interactive controls.
- Design decision-focused Tableau experiences that combine advanced analytics, accessibility, and visual storytelling.
Who is the course for?
This course is designed for learners who have completed a foundational Tableau course or have working familiarity with Tableau Desktop and are ready to move into calculations, analytical depth, and professional dashboard design. The primary audience includes data analysts, BI developers, and reporting specialists looking to strengthen their Tableau capability beyond basic chart building and move into work that requires business logic, advanced analytical techniques, and polished, interactive dashboards.
It directly supports career progression for roles such as Senior Data Analyst, BI Analyst, Tableau Developer, and Analytics Consultant across sectors including finance, retail, healthcare, consulting, and technology, where the ability to build calculated metrics, apply LOD expressions, and deliver executive-grade dashboards is a clear differentiator in hiring and promotion decisions.
The course is also relevant for business analysts who need to own their reporting end-to-end, team leads responsible for setting a dashboard design standard, and professionals preparing for the Tableau Desktop Specialist or Tableau Certified Data Analyst certification. Basic Tableau experience is required; learners should be comfortable connecting to data and building simple views before joining.
Who will you learn with?

Who developed the course?

Edureka
Edureka is a global online learning platform offering industry-focused training in emerging technologies such as Cloud, AI, GenAI, Data Science, DevOps, and Cybersecurity, helping professionals upskill and advance their careers.

Start learning today - free 2-day trial
After your free trial you can:
- Pay $39 per month to keep learning online
- Have complete control over your subscription; you can cancel any time
- Work at your own pace and set your own deadlines at every stage
- Only pay while you’re learning; the subscription will cancel automatically when you finish
- Complete online assessments to test your knowledge and prove your skills
- Earn digital course certificates and a final award that you can share online, with potential employers, and your professional network
- Keep access to the content of courses you complete even after your subscription ends
Learning on FutureLearn
Your learning, your rules
- Courses are split into weeks, activities, and steps to help you keep track of your learning
- Learn through a mix of bite-sized videos, long- and short-form articles, audio, and practical activities
- Stay motivated by using the Progress page to keep track of your step completion and assessment scores
Join a global classroom
- Experience the power of social learning, and get inspired by an international network of learners
- Share ideas with your peers and course educators on every step of the course
- Join the conversation by reading, @ing, liking, bookmarking, and replying to comments from others
Map your progress
- As you work through the course, use notifications and the Progress page to guide your learning
- Whenever you’re ready, mark each step as complete, you’re in control
- Complete 90% of course steps and all of the assessments to earn your certificate
Want to know more about learning on FutureLearn? Using FutureLearn


