This course is part of the Data Analytics for Decision Making with Tableau ExpertTrack
Tableau Foundations for Modern Visual Analytics
Develop your Tableau skills to learn how to connect, prepare, and analyse data to create meaningful interactive dashboards.

Duration
3 weeksWeekly study
3 hours100% online
How it worksIncluded in an ExpertTrack
Course 1 of 4
Tableau Foundations for Modern Visual Analytics
Build your data visualisation skills with Tableau
Tableau is a powerful data visualisation and business intelligence tool that helps organisations turn data into clear, actionable insights. On this three-week course, you’ll explore how Tableau supports modern visual analytics and develop the practical skills to create your own dashboards.
You’ll get to know the Tableau ecosystem and understand how core concepts shape your data analysis.
Learn to connect and prepare data in Tableau
Before you can create effective data visualisations, you need reliable data. You’ll learn how to connect Tableau to common data sources, including Excel, CSV files, databases, and cloud sources, and understand when to use live connections or extracts.
You’ll also explore data preparation using Tableau Prep Builder. From joins, unions, and relationships to cleaning, grouping, pivoting, and aggregation, you’ll learn how to transform raw data into analysis-ready datasets.
Create interactive Tableau dashboards
Turn your data into compelling visual stories using Tableau’s core visualisation tools. You’ll create bar charts, line charts, scatter plots, maps, tree maps, and tables, learning how to select the right visualisation for different analytical questions.
You’ll then bring your work together in an interactive Tableau dashboard, applying filters, sorting, tooltips, layout principles, and basic dashboard actions.
By the end of the course, you’ll have created and published a beginner dashboard that demonstrates your new data visualisation skills.
Syllabus
Week 1
BI and Tableau Essentials


Navigating Your BI and Tableau Journey
Begin your Tableau journey by exploring the role of Business Intelligence in today's data-driven world. Discover how Tableau empowers organisations to turn data into actionable insights.

Data-Driven Decisions and Self-Service Analytics
Explore how Business Intelligence enables data-driven decision-making across modern organisations. Understand the shift towards self-service analytics and why it is transforming the way businesses work.

Exploring the Tableau Ecosystem
Navigate the Tableau ecosystem and discover the platforms, products, and workflows behind modern visual analytics. Learn how Tableau supports data-driven decision-making across industries.

Your Command Center: Tableau Desktop
Set up Tableau Desktop and become familiar with its workspace, interface, and core features. Build the confidence to navigate the environment and begin creating visualisations.
Week 2
Data Connectivity, Preparation, and Modeling

Connect and Prepare Your Data
Connect Tableau to a variety of data sources and prepare clean, reliable datasets for analysis. Learn the essential techniques that improve data quality and readiness.

Build an Analysis-Ready Data Model
Construct efficient data models by organising tables and defining the right relationships in Tableau. Apply modelling techniques that support accurate and scalable analysis.

Validate Your Data Preparation Workflow
Evaluate your data preparation workflow by applying modelling best practices and quality checks. Strengthen your datasets to ensure reliable and meaningful visual analysis.
Week 3
Core Visualisations and Your First Dashboard

Build Effective Tableau Visualisations
Create effective visualisations by selecting the right charts and refining them with Tableau's visual design features. Learn how to present data clearly and tell meaningful stories.

Enhance Visualisations with Interactivity and Design
Enhance your visualisations with filters, sorting, sets, and interactive features that encourage exploration. Apply design best practices to create intuitive and engaging dashboards.

Build and Publish Your First Dashboard
Develop your first interactive Tableau dashboard and prepare it for sharing with others. Bring together visualisations and design principles to communicate insights with confidence.
Prove you're job ready
Highlight the new, job-relevant skills you’ve gained and supplement existing qualifications with a hard-earned, industry-specific digital certificate – plus one for every course within your ExpertTrack.
- Learn the latest in your chosen industry or subject.
- Complete each course and pass assessments.
- Receive certificates validated by the educating organisation.
- Impress employers with learning outcomes you can add to your CV.
- Make your career dreams a reality.
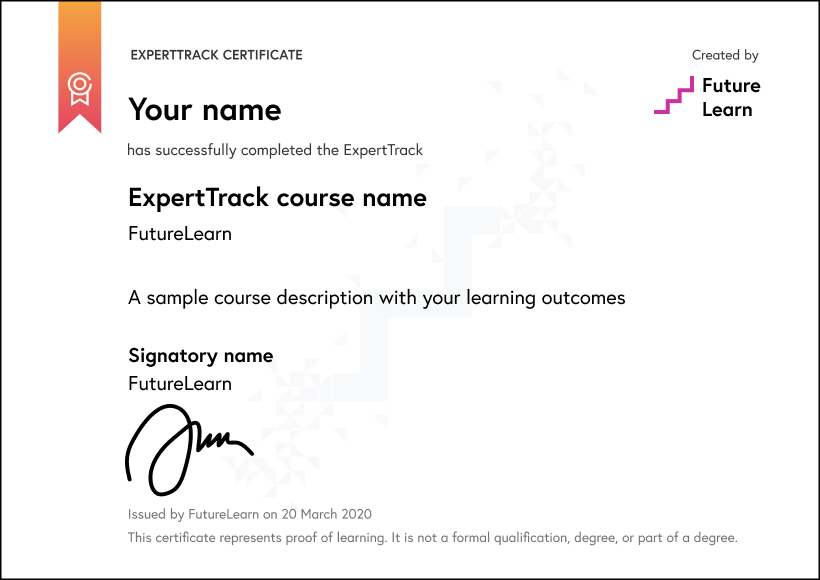
Download a PDF
Learning on this course
On every step of the course you can meet other learners, share your ideas and join in with active discussions in the comments.
What will you achieve?
By the end of the course, you‘ll be able to...
- Assess datasets and data models to ensure they support accurate and reliable visual analysis.
- Evaluate chart types, visual design choices, and dashboard components for effective data communication.
- Create interactive visualisations and dashboards using Tableau Desktop and Tableau Public.
- Design end-to-end visual analytics workflows that transform business data into actionable insights.
- Apply Tableau features to connect, prepare, and organise data for visual analysis.
Who is the course for?
This course is designed for learners building a structured foundation in Tableau as part of their professional development in data and analytics. It is for aspiring data analysts, BI analysts, reporting specialists, dashboard developers, and business analysts seeking a practical entry point into visual analytics and business intelligence.
It supports career pathways such as Data Analyst, BI Analyst, Tableau Developer, Reporting Analyst, MIS Executive, Dashboard Developer, and Business Analyst across sectors including finance, banking, retail, healthcare, manufacturing, consulting, and technology, where dashboarding and data storytelling skills are increasingly valuable.
The course is also relevant for business professionals in marketing, sales, finance, and operations who want to move beyond Excel-based reporting, team leads evaluating Tableau for business reporting, and graduates building an analytics portfolio. No prior Tableau experience is required; basic comfort with Excel and tabular data is sufficient.
What software or tools do you need?
No prior Tableau experience is required. Learners should have basic computer skills, familiarity with fundamental data concepts such as rows, columns and spreadsheets, access to a Windows or macOS computer, and a stable internet connection.
Who will you learn with?

Who developed the course?

Edureka
Edureka is a global online learning platform offering industry-focused training in emerging technologies such as Cloud, AI, GenAI, Data Science, DevOps, and Cybersecurity, helping professionals upskill and advance their careers.

Start learning today - free 2-day trial
After your free trial you can:
- Pay $39 per month to keep learning online
- Have complete control over your subscription; you can cancel any time
- Work at your own pace and set your own deadlines at every stage
- Only pay while you’re learning; the subscription will cancel automatically when you finish
- Complete online assessments to test your knowledge and prove your skills
- Earn digital course certificates and a final award that you can share online, with potential employers, and your professional network
- Keep access to the content of courses you complete even after your subscription ends
Learning on FutureLearn
Your learning, your rules
- Courses are split into weeks, activities, and steps to help you keep track of your learning
- Learn through a mix of bite-sized videos, long- and short-form articles, audio, and practical activities
- Stay motivated by using the Progress page to keep track of your step completion and assessment scores
Join a global classroom
- Experience the power of social learning, and get inspired by an international network of learners
- Share ideas with your peers and course educators on every step of the course
- Join the conversation by reading, @ing, liking, bookmarking, and replying to comments from others
Map your progress
- As you work through the course, use notifications and the Progress page to guide your learning
- Whenever you’re ready, mark each step as complete, you’re in control
- Complete 90% of course steps and all of the assessments to earn your certificate
Want to know more about learning on FutureLearn? Using FutureLearn


