This course is part of the Data Science with Python ExpertTrack
Data Analysis and Visualisation with Python
Gain practical data analysis skills and learn to collect, prepare, and visualise data using industry-standard techniques.

Duration
3 weeksWeekly study
3 hours100% online
How it worksIncluded in an ExpertTrack
Course 2 of 4
Data Analysis and Visualisation with Python
Learn data analysis with Python
Data analysis is at the heart of data science, helping organisations uncover insights that drive better decisions. On this three-week course, you’ll learn how to collect, prepare, and analyse data using Python while developing practical skills used by data professionals across industries.
You’ll begin by exploring web scraping techniques to collect data from online sources before learning how to prepare datasets for analysis. Along the way, you’ll gain experience with the workflows and tools used to turn raw data into meaningful business insights.
Prepare data for analysis with confidence
High-quality analysis starts with well-prepared data. You’ll explore essential data preprocessing techniques, including handling missing values, scaling features, and encoding categorical data to create clean, reliable datasets.
These practical skills will help you understand how data is prepared for analysis and modelling, giving you the confidence to work with real-world datasets.
Create compelling data visualisations with Python
Learn how to communicate insights through clear and engaging data visualisation using two of Python’s most widely used libraries: Matplotlib and Seaborn.
You’ll create a range of visualisations before applying data storytelling principles to combine multiple visuals into audience-ready reports. You’ll also conduct exploratory data analysis to identify trends, patterns, and relationships that support data-driven decision-making.
Gain career-ready skills from experienced data science professionals at Edureka
Throughout the course, you’ll learn from the experts at Edureka to develop the data analysis and data visualisation skills employers value. With this knowledge, you’ll be prepared for future roles in data science, data analytics, and business intelligence.
Syllabus
Week 1
Data Acquisition and Preprocessing


Foundations of Data Analysis
Explore how raw data becomes reliable evidence by examining the data analysis process, key quality checks and the decisions that shape trustworthy insights.

Collecting Data with Web Scraping
Capture valuable web data using Requests and BeautifulSoup, while applying responsible scraping practices to organise information for reliable analysis.

Handling Missing Data and Feature Scaling
Refine dataset quality by treating missing values and scaling numerical features to create consistent, analysis-ready data.

Encoding and Preparing Analysis-Ready Data
Prepare raw data for reliable analysis by encoding categorical features and combining preprocessing steps into a structured, reusable workflow.
Week 2
Data Visualisation and Storytelling

Visualisation with Matplotlib
Visualise data clearly with Matplotlib by creating charts that reveal trends, comparisons and distributions.

Statistical Visualisation with Seaborn
Reveal deeper patterns in data with Seaborn by examining distributions, relationships and polished multi-plot visualisations.

Data Storytelling and Visual Reporting
Communicate analytical findings effectively by combining visuals into coherent narratives, reports and dashboard-style summaries.
Week 3
Exploratory Data Analysis and Insight Presentation

The EDA Workflow
Investigate datasets systematically by profiling data quality, examining distributions and relationships, and using visual evidence to uncover meaningful patterns.

End-to-End Data Analysis Project
Synthesize the complete data analysis workflow by preparing real-world data, generating evidence-based insights and presenting findings for a clear audience and purpose.
Prove you're job ready
Highlight the new, job-relevant skills you’ve gained and supplement existing qualifications with a hard-earned, industry-specific digital certificate – plus one for every course within your ExpertTrack.
- Learn the latest in your chosen industry or subject.
- Complete each course and pass assessments.
- Receive certificates validated by the educating organisation.
- Impress employers with learning outcomes you can add to your CV.
- Make your career dreams a reality.
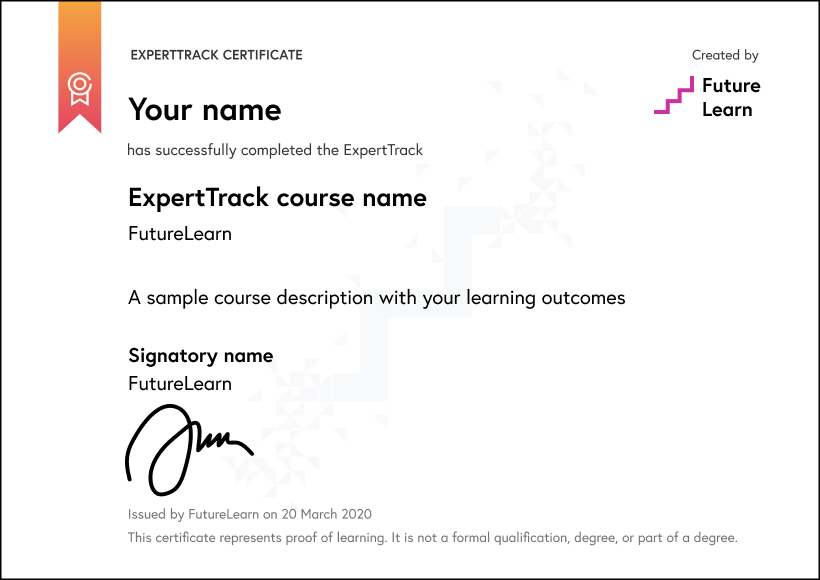
Download a PDF
Learning on this course
On every step of the course you can meet other learners, share your ideas and join in with active discussions in the comments.
What will you achieve?
By the end of the course, you‘ll be able to...
- Explain key principles of responsible data collection, preprocessing, visualisation, and exploratory data analysis.
- Apply Python techniques to collect, clean, scale, encode, and prepare data for analysis.
- Investigate datasets using exploratory analysis and statistical visualisation to identify patterns, relationships, and data-quality issues.
- Evaluate appropriate charts, visualisation techniques, and reporting approaches for different analytical questions and audiences.
- Create clear, audience-ready visual reports and data stories that communicate evidence-based insights effectively.
Who is the course for?
This course is designed for aspiring data professionals, software developers, analysts, engineers, and business professionals who want to build practical data science skills with Python. No prior data science or machine learning experience is required, though basic computer literacy and comfort with logical problem-solving will be helpful.
It is ideal for career changers moving into data roles, working professionals looking to add analytics capabilities to their current role, and graduates preparing for data analyst, data scientist, or machine learning engineer positions. It is also valuable for managers and domain experts who want to understand how data-driven decisions are made.
Who will you learn with?

Who developed the course?

Edureka
Edureka is a global online learning platform offering industry-focused training in emerging technologies such as Cloud, AI, GenAI, Data Science, DevOps, and Cybersecurity, helping professionals upskill and advance their careers.

Start learning today - free 2-day trial
After your free trial you can:
- Pay $39 per month to keep learning online
- Have complete control over your subscription; you can cancel any time
- Work at your own pace and set your own deadlines at every stage
- Only pay while you’re learning; the subscription will cancel automatically when you finish
- Complete online assessments to test your knowledge and prove your skills
- Earn digital course certificates and a final award that you can share online, with potential employers, and your professional network
- Keep access to the content of courses you complete even after your subscription ends
Learning on FutureLearn
Your learning, your rules
- Courses are split into weeks, activities, and steps to help you keep track of your learning
- Learn through a mix of bite-sized videos, long- and short-form articles, audio, and practical activities
- Stay motivated by using the Progress page to keep track of your step completion and assessment scores
Join a global classroom
- Experience the power of social learning, and get inspired by an international network of learners
- Share ideas with your peers and course educators on every step of the course
- Join the conversation by reading, @ing, liking, bookmarking, and replying to comments from others
Map your progress
- As you work through the course, use notifications and the Progress page to guide your learning
- Whenever you’re ready, mark each step as complete, you’re in control
- Complete 90% of course steps and all of the assessments to earn your certificate
Want to know more about learning on FutureLearn? Using FutureLearn


