
Getting to know our data
Our goal in the first week will be to explore a basic data analysis in action.
You will be working on a single data set with a single question in mind. You will see how the different tools at your disposal will enable you to reach an answer.
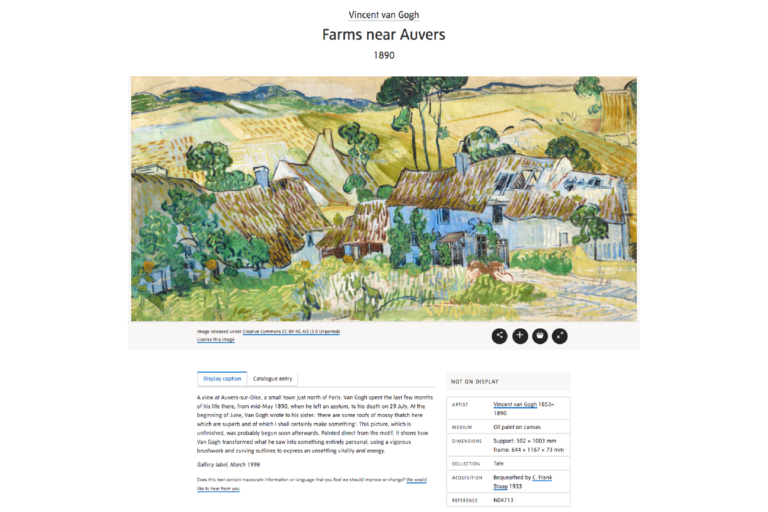
The dataset for the first week is taken from the Tate Museum collection. For each artwork in the collection, the Tate provides us with a preview image, the date of its creation, who the artist was, the medium they used, and other data items. In total, the Tate collection provides online information for more than 64,000 artworks. An example is shown below.
 ©Tate
©Tate
Click the image to expand it
As you can imagine, the quality of this data set is not very uniform: for some artworks the date of creation or even the artist is unknown, and the description of the medium can be very complicated (eg ‘performance, person, coins, wooden floor, spotlights, viewing platform and closed-circuit TV system’).
In order to work with this data, we need to ‘clean’ it, which means that we remove unwanted entries and convert entries into values we can manipulate in Python (or any other package we are working with).
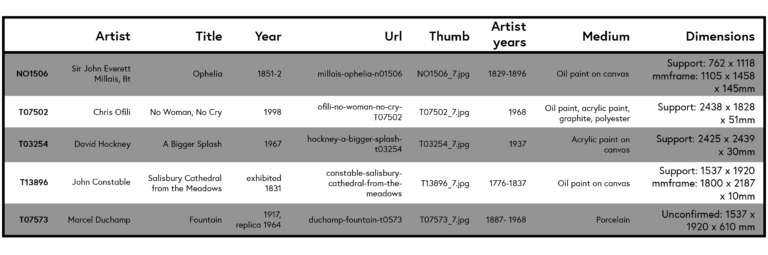
Consider the following table with data we collected from the Tate website:
 Click the table to expand.
The first column contains the collection identifier which we will use as the index of the table: that means that every row of the table has a unique value in this column which we can use to identify it (since it is also the index that the Tate uses, we could relate our findings back to the collection). In database terminology, such a unique identifier is known as a primary key. The columns ‘artist’, ‘title’, ‘URL’ should be self-explanatory. The ‘thumb’ column contains the filename of the image present on the website, ‘medium’ describes with what materials the artwork was created and ‘dimensions’ contains its physical dimensions.
Let us apply the terminology we learnt about earlier to this data, column by column:
-
Artist & Title: names are best described as composite data, ie, as a collection of characters.
-
Year: years are simple data. However, as you can see in the above table, the column does not only contain single numbers but often multiple numbers and even text. We will have to do some work to clean that.
-
Url: a URL is a string of text and best described as composite data.
-
Thumb: the reference to the thumbnail is text, so it is composite data. However, we could also think of the thumbnail image itself being part of the dataset and that is clearly complex data.
-
Artist years: the Artist years (birth, death) are pairs of numbers we should view as composite data.
-
Medium: this column contains short texts which we should treat as composite data.
-
Dimensions: the dimensions of the artworks consist of two or three measurements, sometimes for both the artwork and some supporting structure.
Your task
A general introduction to Juptyer (20 mins).Before you start working with data, your first task is to become familiar with the tools used in this course. This simple task will introduce you to Jupyter Notebooks.You will edit the descriptive text in the Jupyter notebook for this task to see how you can add commentary to your notebooks. You’ll then learn how to run individual cells of code and view the resulting output. By the end of the task, you should be familiar with the basics of operating with Jupyter Notebooks.Go to the Jupyter Notebook task.Do you have any questions or insights that you would like to share after having done this task? Please share them with your fellow learners in the comments.


Reach your personal and professional goals
Unlock access to hundreds of expert online courses and degrees from top universities and educators to gain accredited qualifications and professional CV-building certificates.
Join over 18 million learners to launch, switch or build upon your career, all at your own pace, across a wide range of topic areas.


