Skip main navigation

New offer! Get 30% off one whole year of Unlimited learning. Subscribe for just £249.99 £174.99. New subscribers only. T&Cs apply

Find out more

Data cleaning and pre-processing

What do we mean by 'data cleaning' and why is it necessary? Find out in this article.

Now that we have understood a bit about the data we will be analysing and acquired practical skills on using Jupyter notebooks, it is time to think about how we transform this data into a suitable format for analysis. Our first step is to pre-process the data and clean it. Let us discuss what this means in practice.

Data pre-processing is the activity of transforming the data set into a form that is manageable by the software package we are using, to order answer the question we have posed about the data.

As a simple example, the artist years may actually come as a string of characters rather than as a numeric value (or a couple of values as may be), so during the pre-processing stage we would convert it to a standardised numeric data type which will be easier to manipulate.

Data cleaning (also known as data cleansing) is part of the pre-processing activity, where we wish to modify the data set in some manner to correct erroneous data, remove redundancies, or deal with incomplete or missing data. As a simple example, artist names may come in different formats which are difficult to interpret and may contain extraneous characters with no clear purpose, so are a good candidate for data cleaning.

Let us take a closer look at the ‘raw’ data we got from the Tate museum and, given that we have a machine learning task at hand, ask ourselves a) which parts of the data we will need to solve the task, and b) in what format do we need it:

"A repeat of the previous table of data, where columns and rows store information about each work of art, including the artist, title, year, url, a thumb nail image, artist birth and death, medium used, and dimensions of the art work." Click the table to expand.

Since we will not use the images themselves to solve the task, we can remove the ‘url’ and ‘thumb’ columns from the table during pre-processing. The ‘artist years’ column is also not of much interest so we can also remove it from the table. We may even get rid of the ‘artist’ column, however it might be useful to have the combination of artist/title/year, if we would like to cross-reference our data to external sources. Now, let’s have a closer look at the content of the columns we deem to be useful.

Dates

Notice how the ‘year’ column contains various non-numerical values: we often have a range of years (‘1851-2’) or some form of qualification (‘exhibited 1831’). If we would like to work with creation year of artworks as a numeric value, we need to convert any of these non-numerical entries into a single year—or else we may decide to drop the whole row from the table.

Regardless, we need to document what we are doing, in case we later need some information we may have removed. In our particular situation, we do not need to be incredibly precise, as the ballpark figure for the year of creation will be sufficient.

The detailed logic of how we convert text such as ‘?c.1928-42’ into a number is beyond the scope of this part, but we can show the results of this transformation; once you become more proficient in Python such transformations will not be too arduous.

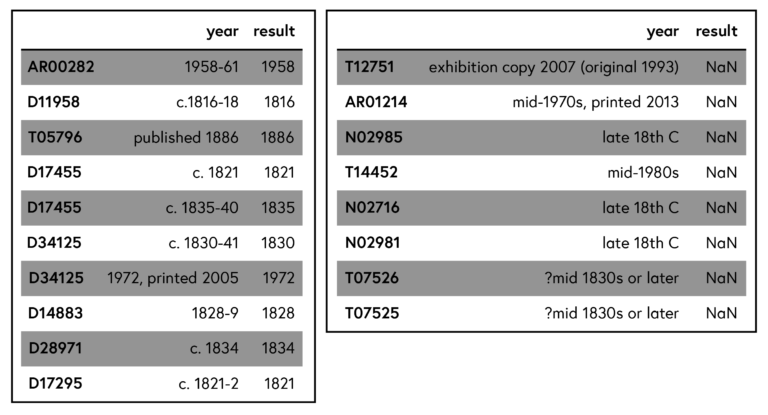
In the left table below you can see a small excerpt of entries from the column ‘year’ and what number our program extracts from the text. We have succeeded in pretty much one-third of the cases. The remaining two-thirds usually contain a variation of ‘date unknown’ in the ‘year’ column and only in a handful of cases, as shown in the right table displayed below, we fail to extract a date despite it containing some information.

As is so often the case in data analysis, when we have a sufficient amount of data, we are not particularly interested in a few selected cases that cannot be cleaned easily, and we can readily just remove those rows from our cleansed table.

"An image of two data tables presented side-by-side, with the left table showing the corrected text for the year of production with entries such as 1958-61 and c. 1816-18, converted to 1958 and 1816 respectively and displayed in a neighbouring column The table on the right shows a sample of rows that were not pre-processed correctly, and consequently dropped."

Click the table to expand.

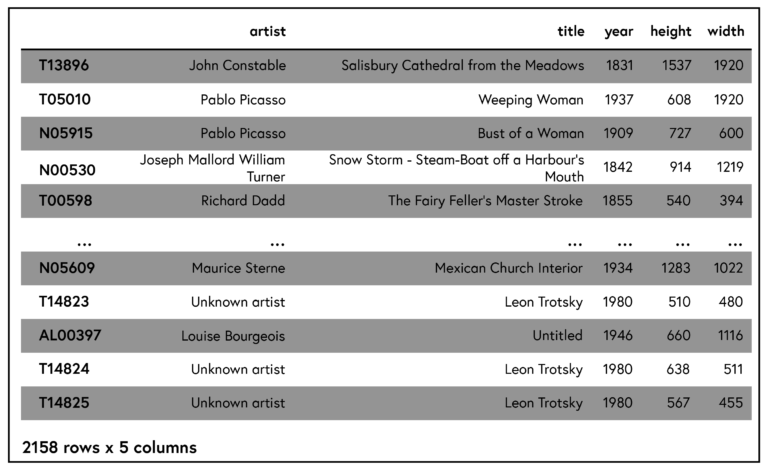
Our main question for this data set only relates to paintings. We, therefore, restrict ourselves to those rows in which we find ‘oil on canvas’ as the medium. We will also later wish to work with the dimensions of these paintings, so similar to the ‘year’ column the ‘dimensions’ column needs some cleansing; in particular, we have decided to split it into two columns ‘height’ and ‘width’. After some more pre-processing (and the removal of malformed or unparseable rows), we arrive at the following subset of our data which still leaves us with almost 2160 paintings:

"An image of our pre-processed dataset composed of a data table containing columns for artist, title, cleaned year of production, height and width of the painting" Click the table to expand.

To summarise, we are left with columns, where the ‘height’ and ‘width’ columns now contain what we have extracted from the original ‘dimensions’ column. We removed other columns such as ‘artist years’ and ‘URL’, as they will not be of help in solving the problem we have been tasked to do. Note that we kept the index of the original dataset, which means we can always recover those ‘missing’ columns by retrieving them from the original data set should we need to. To conclude, we now have the data set we will work with for the remaining part of the week.

Your task

Indexing with pandas (allow 45 mins)
The last task asked you to find the range of the year column and to figure out which is the earliest and the latest year for which the collection contains a painting. But of course, you would also like to know which paintings those were. You need to figure out how to select certain rows of the data. In this task, you will be introduced to boolean indices.
Having worked through the boolean indexing examples, you will work towards answering the question posed at the beginning: what is the earliest and what is the latest painting in the collection?
To achieve this, you will be asked to write a short piece of code to find the earliest and latest paintings in the collection. After you complete the task, discuss your findings in the comments section.
© Coventry University. CC BY-NC 4.0
This article is from the free online

Applied Data Science

Created by
FutureLearn - Learning For Life

Reach your personal and professional goals

Unlock access to hundreds of expert online courses and degrees from top universities and educators to gain accredited qualifications and professional CV-building certificates.

Join over 18 million learners to launch, switch or build upon your career, all at your own pace, across a wide range of topic areas.

Start Learning now