
How good is the model?
In the last activity we built our first model. It was based on rather simple assumptions about the data, but we still hope that it does a decent job in classifying the data. But of course, we should validate this, leading to the question: how should we evaluate our model?
In a sense we need to ‘cheat’; to evaluate our model we need to know the correct answer to the question we are asking, at least for some subset of the data. This subset is often referred to as the ‘ground truth’ of a data set, also known as labelled data. Let us be clear, the ground truth is not necessarily the best possible answer to a question, but it is the best possible answer that we know; the ‘ground truth’ is often categorised (or labelled) by humans and there may be some disagreement for example on whether a painting is a landscape or a portrait.
Model training usually proceeds by the machine learning algorithm adjusting the parameters of the current, approximate, model until it agrees in large parts with the ground truth; this phase is called model training. The underlying assumption is that if a model works well on the subset of the data that we know the answer to, then it should also work well on the rest of the data (and hopefully other data sets if the model generalises well). There are various refinements to this approach, but the underlying assumption does not change, and we should always be conscious of it.
In practice, data scientists will often divide the labelled data into two disjoint subsets: the training data, to train the model, and the test data to evaluate the model. This ensures that the model does not ‘cheat’ by simply memorising the data, instead, it needs to find out patterns in the training data that also exist in the test data.
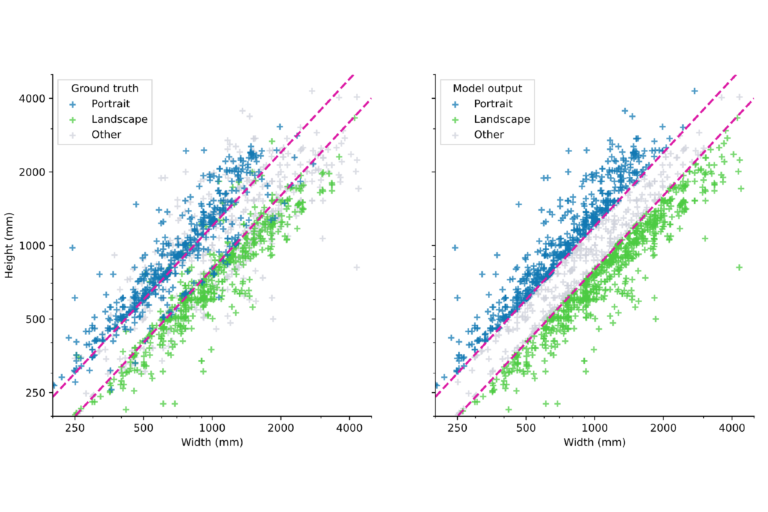
For the purpose of this course, we have labelled (by hand) the over 2,000 paintings in the dataset and will use this as our test data. Let’s see how the plots showing the ground truth and the model compare.
 Click to expand.
On the left we now see the ground truth data, the blue points are actual portraits, the green points are actual landscapes, and the grey points everything else. Contrast this to how our simple model labels the data, and it looks quite similar.
Most of the portraits (blue points) lie indeed above the upper decision boundary and most of the landscapes lie below the lower decision boundary.
There are a few extreme outliers in both directions: green data points that are squarely surrounded by blue points and vice-versa. Even advanced models, let alone our very simple model, have a lot of trouble to classify these points correctly. We could, however, hope to achieve better results for the points between the two decision boundaries. For example, if our decision boundary could be a curve with a few bumps, our model might be able to correctly classify a few more points.
Not all models can be inspected visually (interpreting plots can often be deceptive) and we would like to be more precise in our assessment. We would also like to have a more standardised measure for models, this is particularly important when it comes to comparing several models. A standard method to do the comparison is to use confusion matrices. A confusion matrix tells us what kind of errors our model makes on the test data, ie how many labels it gets wrong and how many labels it gets right. In our example we have three labels, therefore there are three ways in which the model can be right (the diagonal values in the matrix) and six in which it can be wrong. The confusion matrix shows all those errors as percentages:
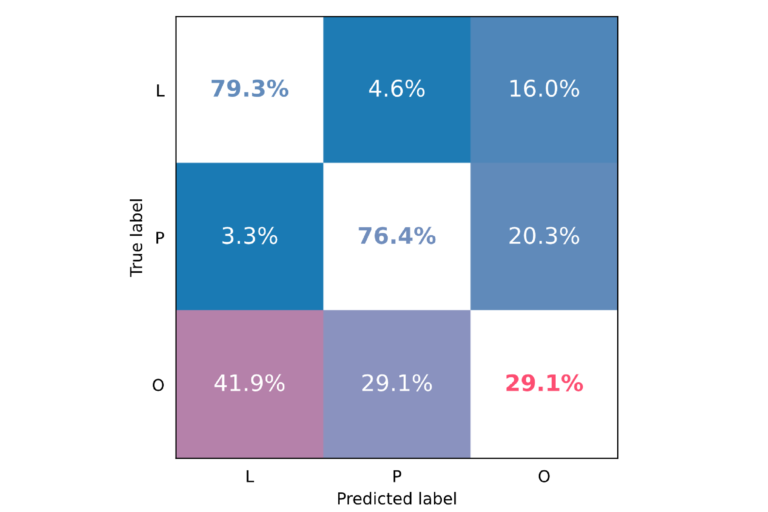
Let us read the matrix row-by-row. To all paintings labelled landscape (L) in the ground truth it assigns for 79.3% the correct label (L) and labels 4.6% mistakenly as portrait (P) and 16% as other (O). Regarding portraits (P), our models assign the wrong label L in 3.3% of cases, the correct label P in 76.4% of cases, and the wrong label O in 20.3% of cases. Finally, for paintings that are neither portraits nor landscapes, the model assigns the wrong label L 41.9% of the time, the wrong label P 29.1% of the time and gets it right in 29.1% of all cases.
In general, we would like the values on the diagonal to be as high as possible and all other values to be as low as possible. For visualisation purposes, we, therefore, apply a colour scheme where high values on the diagonal are blue and low values are red and vice-versa for all other entries.
Interpreting these values, we can see that the model is good at finding landscapes and portraits, but at the cost of lumping in a lot of other paintings between these two categories.
This tells us that landscape paintings indeed most of the time have a landscape format, and portrait paintings portrait format. Of course, paintings of other things will often also follow one of those two formats and this is, expectedly, where our model fails. Our next step will be to build a model using the remaining data that is available to us besides the geometry of the paintings and see whether we can improve on this shortcoming.


Reach your personal and professional goals
Unlock access to hundreds of expert online courses and degrees from top universities and educators to gain accredited qualifications and professional CV-building certificates.
Join over 18 million learners to launch, switch or build upon your career, all at your own pace, across a wide range of topic areas.


