
Increasing the complexity of our modelling
We should take a step back here and reflect on how we built our models: we first selected a subset of our data to work with and then grouped the data according to these values.
Notice that if the selected data for two paintings is the same, then our models will invariably label them in the same manner. Two paintings with the same ratio will always receive the same label by the ratio model and two paintings that contain the same keyword in their title will always receive the same label by the title model.
Furthermore, we expect that most of the time our models to label ‘similar’ data with the same label. In that sense, our models describe which paintings are similar and which ones are dissimilar and decide labels according to this measure.
This idea is what lets us build more complex models and draw on powerful existing techniques. In order to apply them, we first need to translate our data into so-called vectors. Fundamentally, a vector is a collection of numbers or entries, not unlike a row in table. The number of entries is the dimension of the vector. It is sometimes useful to imagine vectors as points in space, although this intuition fails for more than three dimensions. For example, the following business locations in London can be interpreted as two-dimensional vectors on a two-dimensional plane (we can ignore the earth’s curvature for such small scales):
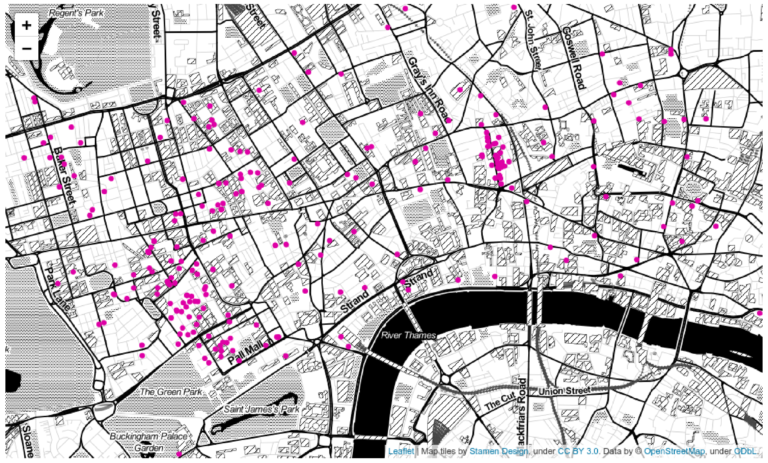 Click image to expand.
Some data is already naturally represented as vectors, like GPS coordinates which consist of two entries, latitude and longitude. Other, more complex, data can sometimes be mapped onto vectors (in this case often called features) which captures some of its aspects.
In either case, the notion of similarity or distance is crucial: we can take two vectors and compare them. In this example, the distance between two vectors will most likely be the natural geographical distance in miles or kilometres, which is also called the Euclideian distance. We discuss other types of metrics in the next step.


Reach your personal and professional goals
Unlock access to hundreds of expert online courses and degrees from top universities and educators to gain accredited qualifications and professional CV-building certificates.
Join over 18 million learners to launch, switch or build upon your career, all at your own pace, across a wide range of topic areas.


