
Classification and clustering
In order to improve our artwork model, we are now going to combine the ratio and title models using the ideas introduced in the previous step.
In order to do that, we need to a) combine the data that these models use and b) map this joint information onto vectors.
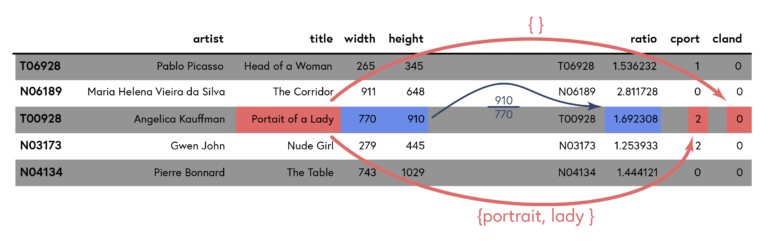
The ratio is already a number, we can use it as the first entry of our vector. In order to include the information about keywords in the title, we add two more entries: the first one counts the number of portrait keywords in the title, the second one the number of landscape keywords. Let’s see a quick example of how this mapping works:
 Click image to expand.
In the above example, ‘Portrait of a Lady’ by Angelica Kauffman has a ratio of (frac{910}{770}≈1.69) which turns into the first coordinate of the resulting vector. The title contains the portrait keywords ‘portrait’ and ‘lady’, therefore the second entry of the vector is two. Analogous, the title contains no landscape keywords and therefore the third entry is zero.
After transforming our data into vectors, we can now pass it to any number of existing machine learning algorithms. The ‘learning’ refers to the fact that we do not program these algorithms to make decisions by hand, instead they find out how to make decisions on their own. Learning algorithms come in two broad flavours: Supervised learning algorithms are provided with training data that has been labelled with the ‘correct answer’. We usually refer to this information as the ground truth – as we have previously discussed. Supervised learning algorithms then learn how to reproduce the ground truth label from the data itself, with various trade-offs. Once it has ‘learned’, the algorithm can then predict labels from data, in particular for new data that has no ground truth assigned to it.
Unsupervised learning algorithms are only provided with unlabelled data and attempt to figure out the labels by themselves, meaning that they attempt to group the data according to a prescribed similarity or distance measure, exactly like we did by hand in the last activity. In the context of this course, we will call these groups clusters.
Coming back to the Tate data, we will apply one of the basic unsupervised learning algorithms to our three-dimensional set of vectors: the k-means algorithm. The only information k-means needs besides the input vectors is the number of clusters k that we would like to have. K-means will then attempt to find k points in the vector space which act as the centres of the respective clusters, subsequently, every vector from the input is then mapped to the closest centre to form clusters. We ask k-means to produce three clusters in the hopes that they capture the three labels L, P and O.
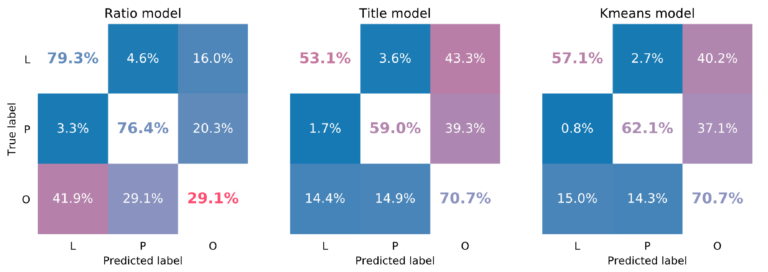
The resulting confusion matrices including the previous ones are given by:
 Click image to expand.
We see a modest but noticeable improvement across the L and P labels, the O label remains at 70.7% when compared to the title model. The ratio model is still superior in detecting landscape and portraits, but as we discussed that came at a cost of a very low precision for other motives.
This improvement might not seem much, but it is rather typical of the non-linear nature of a learning algorithm’s performance: very simple models already perform well and we see only small improvements when we apply more complicated methods. For that reason, we should always build a simple model that gives us a performance baseline.
One big advantage of learning algorithms such as the k-means model is that we can easily add or remove certain information about the data by adding or removing dimensions from our vectors; this activity is called feature selection. This is often very cumbersome with hand-crafted models and one of the reasons why translating our domain-problem into a problem on vectors is so useful.


Reach your personal and professional goals
Unlock access to hundreds of expert online courses and degrees from top universities and educators to gain accredited qualifications and professional CV-building certificates.
Join over 18 million learners to launch, switch or build upon your career, all at your own pace, across a wide range of topic areas.


