
The curse of dimensionality: organising data in high-dimensional spaces
Have you ever tried to explain a complex topic or discuss the information and different characteristics of a dataset with a friend and somewhere in the middle you were struggling to continue and keep the explanation simple and to the point?
This problem is the essence of what is known as the ‘curse of dimensionality’. We face a similar problem when we are working with massive data sets that have a high number of characteristics. A simple example is a dataset with several columns that are also known as features such as user ID, name, age, year, city, and so on. Which of these features are the most important for a query we make over the data set and, what features contribute more to the purpose underlying our data analysis?
A feature of a dataset is an individual property that exists in the dataset such as ‘city name’, ‘city population’, ‘telephone number’ or ‘salary’ of a person say in an employee’s dataset. It is fair to say that the more features we have, the more difficult it is to ‘explain’ the dataset and reveal its secrets.
It turns out that moving from low (having a small number of features) to high dimensional spaces (having a high number of features) causes our data to behave differently and makes data analytics a challenging task to the human eye. The concept of the curse of dimensionality technically affects the training of a data model using our predefined dataset aiming to minimise a ‘cost function’. The cost function quantifies the error between a predicted and an expected value. For example in a learn regression model such as the one presented in the first week we aimed to fit our data set to a line. The cost function to be minimised in this case would normally be the of distances, or squared distances to the fitted line.
As we add more and more dimensions, we are moving from a two-dimensional to three-dimensional and finally to a higher multidimensional space, so it is highly likely that a new data instance will move further away, in distance from any training instance, making predictions unreliable.
Theoretically, the curse of dimensionality refers to the phenomena that occur when organising and analysing high dimensional data that do not occur in low dimensional spaces a concept that includes what is known as data ‘sparsity’ and ‘closeness’.
Let us explore these terms in more detail.
Sparsity
Sparsity refers to the volume of data that resides in a space. As more dimensions are added to the analysis, the size of the space increases, however, the data becomes more and more sparse due to the number of possible data items increasing exponentially.
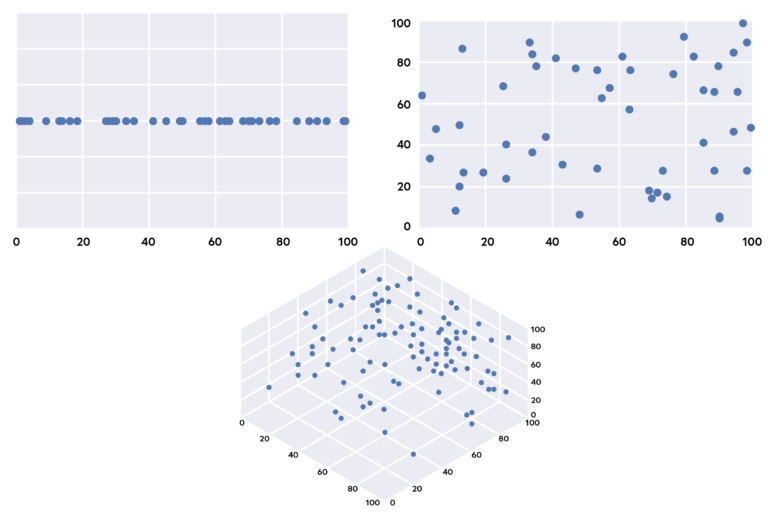
The image below shows an example of increased sparsity as more dimensions are added to a random dataset. This is related to the concept of exponential growth: where the speed of growth is proportional to the size of the data, following an exponential function. The left side diagram shows that our data is divided into sets of regions while moving to a two-dimensional space, we now have more regions to consider, so sparsity is increased, relative to the full volume of the space. In contrast, in the three-dimensional space, we have an exponentially increased number of regions (to the third power). Considering the right diagram, it is quite difficult for the human eye to understand the relationships between the data items, possible correlations between features or, to detect patterns that may be present in the data.
Let us assume that the diagram on the left-hand side is a person’s salary, the diagram in the middle is the salary per city population, and the third diagram on the right-hand side is the salary per age per city population. The question here is: do we have enough data to understand our dataset and build a robust model? Obviously, the answer to this question affects what is called as training a test data of the model.
 Click image to expand.
These figures show the sparsity of data as dimensions is increased.
Closeness
Closeness refers to the organisation of data according to a given criterion, for example, when we need to sort or classify a dataset according to its features. Moving from low to high dimensional spaces can cause data to look very similar (eg in two-dimensional space) and become scattered when adding more dimensions (eg three-dimensional).
So, how do we deal with the curse of dimensionality problem? As a data scientist, we need to carefully consider which features to select to support our model, having in mind that the more features we add, the greater the exponential increase of the dataset is. In theory, one possible solution to the curse of dimensionality is to have a very rich training set; however, the number of instances required to reach a given density grows exponentially, making analysis difficult and quite tricky.
To overcome this problem a common approach is also to use the so-called ‘dimensionality reduction’ techniques, where we reduce the number of features used, thus making data analytics easier for our algorithms to use. There are various techniques that may be used, one well-known and popular one is ‘Principal Component Analysis’ that transforms a dataset to the most informative space, by reducing its number of dimensions.


Reach your personal and professional goals
Unlock access to hundreds of expert online courses and degrees from top universities and educators to gain accredited qualifications and professional CV-building certificates.
Join over 18 million learners to launch, switch or build upon your career, all at your own pace, across a wide range of topic areas.


