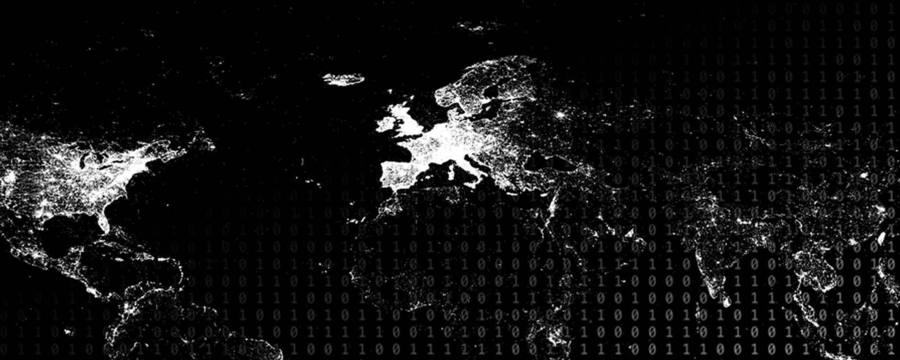
Skip main navigation

New offer! Get 30% off your first 2 months of Unlimited Monthly. Start your subscription for just £29.99 £19.99. New subscribers only. T&Cs apply

Find out more

Week 8 round-up

Week 8 round-up
3
SUZY MOAT: Hi, Tobias. So Chanuki’s not here this week.
7.5
TOBIAS PREIS: We will get through it. Don’t worry. There are lots of questions.
10.8
SUZY MOAT: Let’s see how far we can get.
11.9
TOBIAS PREIS: Exactly.
12.6
SUZY MOAT: Yes. No, I know. We were looking through the course. We saw the Learners had asked quite a few questions. So maybe we should try and go through a few?
20.2
TOBIAS PREIS: Let’s go for it then.
21.7
SUZY MOAT: Fantastic. All right, so one of the studies we were talking about this week was an analysis that we’d carried out around Hurricane Sandy.
31.5
TOBIAS PREIS: Oh, yes.
32.5
SUZY MOAT: Where we’d seen that when air pressure fell when the hurricane hit, the state of New Jersey, we saw that with the air pressure fall, there was also a rise in the number of Flickr photographs tagged hurricane, sandy, or hurricanesandy. But one of the Learners was asking, well, you know– so we were trying– we motivated this study. Our interest was that potentially you might be able to sense the extent of the disaster by looking at metrics of social media activity. But one of the Learners was saying– it’s an interesting point– well, if you’re looking at photographs tagged Sandy, they’re quite possibly not all about that hurricane. You know? What about pictures of deserts or pictures of beaches.
85.4
People might tag those sandy as well. so is that going to skew our results?
89.4
TOBIAS PREIS: That’s a valid point, yes. Absolutely. I mean, it’s a general issue, right? I mean, we have seen this before in other weeks. And we in particular looked at the flu and how people search for flu symptoms. And obviously, I mean, we can’t get really to the detail or to the bottom of every individual search and why this particular search has been carried out. So we are more interested in picking up the changes. And I mean, obviously, now you could say when we look at the particular scenario of Hurricane Sandy, it was towards the end of the year. I mean it wasn’t any longer a season where you would like to go to the beach.
130.6
But there might be all sorts of other reasons why you wanted to upload photos– in this case, it’s not searches– uploading photos which were tagged with this particular term. But, I mean, we need to basically establish a baseline and look at changes, variations around this baseline. And what we have seen, indeed, is actually we were picking up a signal. Right? I mean, the signal itself is a proof or at least some evidence that there is a relationship. Right? I mean, increased attention or activity around Hurricane Sandy with the coincidence that actually at this point in time, Hurricane Sandy reached land, made landfall in New Jersey.
170.5
And so, it’s just another example where you need to dynamically find ways to address changes in activity. But it’s a very good point that the Learners have picked up on there.
182.9
SUZY MOAT: So you’re saying it doesn’t really matter if not all photographs tagged sandy are photographs relating to Hurricane Sandy?
190
TOBIAS PREIS: Yes. Absolutely. I mean, basically during this particular time– obviously, it was a major event, Hurricane Sandy. And so what we have seen is this huge spike in interest, right? And if there’s no particular reason and then people are just for random– let’s call it random reasons, let’s assume for a second are sending out photos tagged with this particular term, then this could be a kind of background noise. Right? I mean, you could see some fluctuations going forward throughout time. But then you have a very clear signal. Right? And this makes the difference.
224
SUZY MOAT: So the point is we could look out for unusual peaks in activity. And we do need to be aware of possible alternative explanations. But in this case, maybe there’s no obvious reason that people would suddenly be tweeting– tweeting, no– posting Flickr photographs about deserts or a beach.
240
TOBIAS PREIS: They might be tweeting too.
241.7
SUZY MOAT: They might be tweeting, yes. We didn’t have that in this study. Right. OK.
245.3
TOBIAS PREIS: I mean, this was a very good question. I have actually another one for you. We were also looking at this example of the football stadium. Right? The study which Federico Botta was conducting–
260.5
SUZY MOAT: Dr. Federico Botta.
262.1
TOBIAS PREIS: Oh, now that’s true. He is now Dr. Federico Botta. And basically, one key question which the Learners have identified, and which we had at that time too, is obviously– I mean, if you would extract the signal from the mobile phone network, from cell towers, how busy they are basically, then do you actually run into problems when they are very, very busy. In other words, what happens if there’s an overload and the cell tower is no longer able to serve all the incoming or connection attempts from mobile phones being in the area.
296.9
SUZY MOAT: I think that’s another excellent question. I think, as always, the Learners are showing they’re very aware of the issues around these new data sets. So that is– I think we both agree– a challenge that needs to be borne in mind when trying to use mobile phone activity to estimate crowd size. But again, I think, you know, as with many of the studies that we’ve been talking about, it’s not about trying to achieve perfection. I don’t think that’s ever anything we want to claim from our own work that we’d achieved. But it’s trying to look at, you know, can we make an advance over what we had before.
339.2
And so I think the big potential is the fact that everybody’s got– so many people have a phone in their pocket. It’s going to be communicating with the mobile phone infrastructure. And we’ve got pretty good geographic granularity, excellent temporal granularity. And so I think that goes beyond other opportunities we have to try and estimate crowd size before, especially if you need really quick estimates, good estimates. So yeah, you possibly are going to experience some sort of ceiling effect at some point. And I think–
380.4
TOBIAS PREIS: You could even pick that up, right? You could measure it increasing crowd size basically at some point. You can’t detect anymore increasing activity from the mobile phone network, or even a drop because basically it causes an entire cascade of connections being dropped.
399
SUZY MOAT: Yes, so I think it underlines again the need for more analyses, more work with this sort of data to understand where those sorts of limits would creep in. But so I think the opportunity in many cases is still there to try and– especially if we’re worried about dangerous situations. I think there is still a possibility to at least see we’re moving towards a dangerous situation. And maybe that opens up opportunities that we struggled to have before to warn people in advance, you know, that you shouldn’t– people should stop moving towards a particular area because it’s very overcrowded.
444.9
But it is, yet another excellent question from the Learners, and definitely something that would need carefully looking at before deploying this in practice. Another point–
456.2
TOBIAS PREIS: What else is left?
456.9
SUZY MOAT: Yeah, so there was another point I saw come up around this study, so Federico’s excellent work. He was talking about a football stadium. So of course the excitement of the football stadium was that it’s one of these rare occasions where we actually have a crowd that we know the size of. so that’s something that’s really important for trying to understand whether we can really use this sort of data– mobile phone data– to estimate crowd size. I think what we as scientists are keen to avoid is just saying oh, it’s probably right. we want to know how correct is it. Can we really see the relationship between mobile phone activity and what’s really happening?
504
But that was a good point. OK. So you’ve tried it in football stadium, obviously in that paper we also looked at airports. But are you going to see the same relationship for, for example, a student protest or a festival or a pilgrimage? Or are you going to need a different model for each of these. So how would you go about extending the results from that initial analysis to these different situations?
526.9
TOBIAS PREIS: Yeah, well, I think this is a very, very good question. And obviously the last few days have just shown other examples around the G20 events which unfolded in Hamburg, in Germany. I mean, obviously there’s all sorts of questions. I mean, how many people were in the protest. Would it actually be translatable? I mean, could you actually use estimates or, more precisely, the coefficients which we’ve worked out for Milan in Italy and apply it somewhere else in the world? And we need to be very careful with this, right? Obviously, there are all sorts of biases involved. There is the general bias of people attending a certain type of event.
568.2
Football games might be different to any other sorts of events. But on the other hand, we actually ring-fenced ourself a little bit by using mobile phone data. And we basically showed that internet activity has at least indicated to be the best estimator for how many people are in an enclosed or restricted environment. And so this doesn’t necessarily require active interaction of the user with any kind of service. So that’s at least reducing a little bit of bias. But there might be other sorts of issues, right? I mean, it depends on the country. It depends on even the city. I don’t know, maybe some events, you’re not allowed to take mobile phones into the event space.
615
Obviously, that’s a very extreme example. But it’s something, possibly more for a closed meeting where nobody wants to have a record of what has been spoken. But there could be all sorts of reasons. So we need to be careful. And for having very accurate estimates, it’s always necessary to have a kind of benchmark, a kind of comparison, for that particular space. Right? I mean we, for example, earlier this year actually looked at Donald Trump, his inauguration. And basically we wanted to solve the puzzle to which extent are claims justified that’s the biggest crowd ever, as someone has put it, has actually witnessed his inauguration at the National Mall in Washington DC.
665.9
So we didn’t have any comparison data, in terms of how many people came to the site of the National Mall. And we also didn’t have any mobile phone data in that case. I mean, we looked at Twitter data. And the very striking or the very good advantage we utilised in that case was that there were two parallel events spread over two days, basically, which was the Women’s March, and the inauguration the day before. And so we didn’t need, to some extent, any ground truth or real world data because we had the same space just separated by one day, so by one day in terms of time. And so we could just compare.
712.8
So how many Twitter posts with GPS text came from that area compared to the day later. And obviously, any result we get there is not necessarily reflecting how many people have been there because there could be– as people argued afterwards when we conducted this analysis– it could be the case that one event is just attracting more people who are tweeting.
743.8
SUZY MOAT: I was going to ask.
746.3
TOBIAS PREIS: You have to be careful about that. But to reveal to the Learners, we basically found that around three times as many people tweeted from the site of the National Mall during the Women’s March compared to the inauguration of Donald Trump. And the aspect which gives us some support in this factor of three is actually some colleagues of ours here in the UK who watch lots of visual footage from the different TV channels in the US, and did some crowd counting based on the TV footage they have watched. And they, after a long exercise, basically, looking through all the material, came up with more or less similar factor of around three.
795.6
And so this is actually reassuring us that there might be something in it.
799.1
SUZY MOAT: So there’s a match between the estimates that we came up with from Twitter data and estimates that others have come up with from more traditional– visual-based approaches to assessing crowd size. But I would say that we were certainly excited about that result. So that was an interesting point.
820.6
TOBIAS PREIS: I mean, that’s another good example, right? And coming back to the question we started all of this with, I mean, it’s either having a real world estimate where you can calibrate your signal with, or you are keeping other aspects constant. Right? The sites– and then you are comparing the activity without actually the need to know how many people are actually being there. You’re just interested in the question, is there more or less activity, the ratio.
849
But this brings us to another and actually a final question for today’s session, because some other Learners started to look into the issue– I mean, we talked about mobile phone data, we also just introduced a little bit what happens if we use Twitter in the US from Washington DC. But what is actually the advantage or disadvantage if we look this space of possible apps we could use? I mean, compared obviously to what people consider to be gold standard data, that’s the phone data, of course.
883.4
SUZY MOAT: So, I suppose it depends what you are trying to do. So a big advantage of mobile phone data is that mobile phones are so ubiquitous now.
897.4
So many people will have one or more, in some cases, mobile phone in their pocket. And so we’ll be able to pick up lots of, you know, large proportions– reasonable to suppose that in many parts of the world, we’ll pick up a large activity from a large proportion of the people who are there. However, if you’re looking at either data geotagged posts to social media sites such as Twitter or Flickr, or maybe an app which people might want to use for the event. And you’re looking at using one of those sources to estimate crowd size. Then there’s advantages and disadvantages. So disadvantages– quite possibly not everybody uses the app. So for example, not everybody uses Twitter.
950.2
Not everybody might have downloaded your app, your information app about your event, for example. But an advantage is that then you get really quite precise information on exactly where the people are, so from their GPS traces that people leave behind. So that will normally give you more precision in terms of where people are, in comparison to mobile phone data. So as with many of these things, it is about what questions you want to ask. Is it more important to capture more people but give up a little bit of spatial precision?
992.1
Or is it more important to have a sample of people, think about what that sample might be, might there be biases, but have a sample of people and for those people, know exactly where they are. So it might give you more information about, you know, are they near a particular stand in your event or something which is a really precise question that you’re really interested in. So there’s advantages and disadvantages. And it depends– what data can you get access to is the other question. Say–
1021.4
TOBIAS PREIS: That’s a very good one, yes.
1022.2
SUZY MOAT: Maybe you don’t have access to the mobile phone data. Maybe the mobile phone company is holding on to that. But maybe you do have access to– like we did for Donald Trump– maybe you have access to social media posts that are publicly available. Or maybe you’ve made your own app for your own event. And then you’d have the data coming into that. So what do you want to do, data availability, all these sorts of questions–
1045
TOBIAS PREIS: And just to highlight one aspect, right? I mean, even if you have access to mobile phone data in one particular country, then it’s maybe not all the different carriers, providers, right? And it’s just in one country. If you have an application or service which runs globally, then obviously you can ask questions in countries where you don’t have access to mobile phone data in the first place.
1066
SUZY MOAT: Yep. Good point. So, next week’s the last week.
1070.1
TOBIAS PREIS: Oh, dear. Yes. Absolutely.
1072.3
SUZY MOAT: Yeah, so I think– I think we’ve got– we’re going to talk a little bit about big data in cities. So something we touched on at the beginning of the course, we’re going to come back and then look at that question again. How can big data help us in a city environment, what sort of data are we generating in light of all the other things that we’ve now covered over the past eight weeks now, nine weeks next week. And in general, we’re going to reflect a little bit on the topics that we’ve looked at and, you know, what might Learners be able to take away from this.
1106.9
What’s it told us about how this data might be good, or indeed in some cases, bad for society. So lot’s of big gnarly questions, I think, around that.
1119
TOBIAS PREIS: An exciting week coming up. I have a few days, actually, to recover. So hopefully the cough is gone by next week.
1125.6
SUZY MOAT: I hope so. I hope so. Well, and we’ll have Chanuki back as well.
1128.8
TOBIAS PREIS: Oh, that’s another advantage–
1130.2
SUZY MOAT: Yeah, I’m sure the Learners will be relieved. Brilliant. OK, well, so I’m looking forward to next week.
1135.8
TOBIAS PREIS: Yes, me too.
1137.6
SUZY MOAT: So we will talk again then with Chanuki
1140.9
TOBIAS PREIS: See you then, possibly again, here.
1143.2
SUZY MOAT: Excellent. OK. We look forward to seeing the Learners then as well.
1146.8
TOBIAS PREIS: All right. Bye bye.
1147.3
SUZY MOAT: OK. Bye.

In Week 8, we began to explore how big data might help reduce the impact of disasters, and how new data sources can help us understand how people move around.

Here’s a brief summary to help you prepare for the final week of the course.

You heard from Federico Botta about a paper we published with him last year on determining crowd sizes using data from mobile phones and Twitter. Mirco Musolesi also talked to us about using smartphone data to understand people’s mobility patterns. You also heard how delivery of aid in Haiti following an earthquake was supported by rapid crowdsourced updates to OpenStreetMap, and considered other examples of how new data sources might help avoid and mitigate disasters.

By the end of last week, you’d also used R to analyse Google Trends data and calculate the Future Orientation Index for 45 different countries around the world. Keep up the great work!

We hope you enjoy your final week!

This article is from the free online

Big Data: Measuring And Predicting Human Behaviour

Created by
FutureLearn - Learning For Life

Reach your personal and professional goals

Unlock access to hundreds of expert online courses and degrees from top universities and educators to gain accredited qualifications and professional CV-building certificates.

Join over 18 million learners to launch, switch or build upon your career, all at your own pace, across a wide range of topic areas.

Start Learning now