Skip main navigation

New offer! Get 30% off one whole year of Unlimited learning. Subscribe for just £249.99 £174.99. New subscribers only. T&Cs apply

Find out more

Storms in the UK: Recent Mid-Latitude Depressions
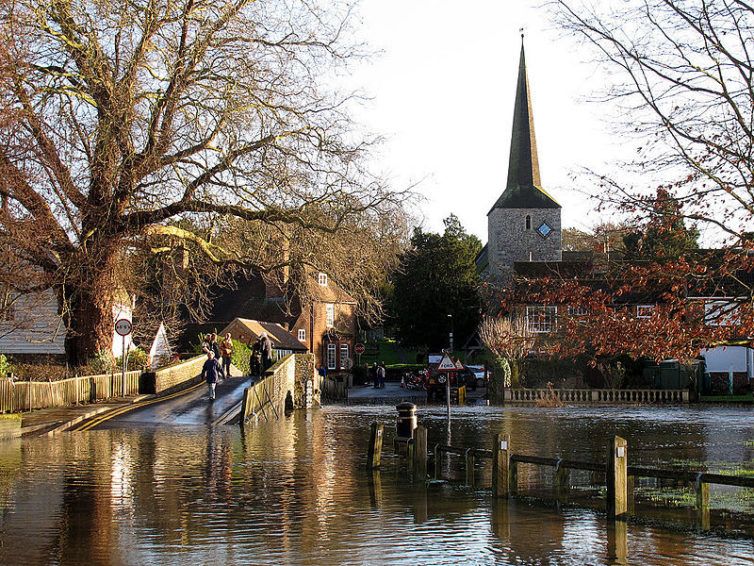
This article discusses recent mid-latitude depressions in the UK, and the weather conditions that made the storms of 2013/14 so damaging.
Depressions In The Uk
© Stephen Craven CC BY-SA 2.0, via Wikimedia Commons

Mid-latitude depressions are areas of low pressure located between 30° and 60° latitude, causing unsettled weather and rain.

The winter of 2013/14 brought 12 major mid-latitude depressions to the UK. It was the stormiest period of weather experienced by the UK for 143 years. It was the wettest winter in England and Wales since 1766 but also a relatively warm one, with the fewest air frosts since 1961. The storms brought widespread flooding, particularly to Somerset. There was much damage in coastal areas, and both natural and made-made features were destroyed.

28 October 2013

The St. Jude’s day storm was the first of the storms on 28 October 2013 (Figure 1). It mainly affected southern England, and led to four deaths and widespread power failure. At the time, comparisons were made with the 16 October, 1987 storm; the most damaging storm in the recent past, but actually neither the intensity of the storm nor the damage it caused were anywhere near as bad.

5 December 2013

That same winter, another damaging storm occurred on 5 December 2013 (Figure 2). This storm had various names, depending on the country including; Bodil/Sven and Xaver. Its impact in the UK was at its greatest when the storm had already moved passed.
In Figure 2, you can see the centre of the Low is over southern Norway in the weather map . Remember that winds blow around a low pressure system in an anticlockwise direction. If you follow the pressure contours, you can see the wind was blowing down the North Sea in a northerly/ slightly west of northerly direction. This wind would have carried some of the surface water with it. Consider the geography of the North Sea. It is widest at the top and narrows to the south. This means that the water carried by the wind was being funnelled into an ever smaller area, increasing the water level as it went.
In addition, when there is low atmospheric pressure, it’s not just air that flows to try and balance the pressure gradient, if the Low is over the sea the water does too. When pressure falls by one millibar, the sea level rises by one centimetre.
Coupled with this, the 5 December was a time of high tides. The tide of course has nothing to do with the weather, but there are times of the month when the difference between high and low tide is much greater (spring tides) and other times when it is smaller (neap tides). The 5 December happened to coincide with a spring tide (Figure 3).
These three factors together led to extremely high water levels in the North Sea. It was the worst tidal surge to affect the UK in 60 years and many coastal communities on the East coast were flooded. The Thames Barrier was closed and successfully protected London.
Figure 3. This diagram displays the tidal range for 1- 17 December 2013 at Whitby in Yorkshire, a seaside town on the North East coast of England. The blue bars show the maximum water height at high tide, and the red bars the minimum height at low tide.

24 December 2013

On the 24 December 2013, an intense depression passed over northern Scotland causing the pressure to fall to 936.8mb at Stornoway around 13:00 local time (Figure 4). This was the 3rd lowest pressure ever observed at a land site in the British Isles (next to a 927mb reading at Belfast, Ireland on 8 December, 1886 and 925.6mb at Ochtertyre, near Crieff in central Scotland on 26 January 1884).

9/10 December 2014

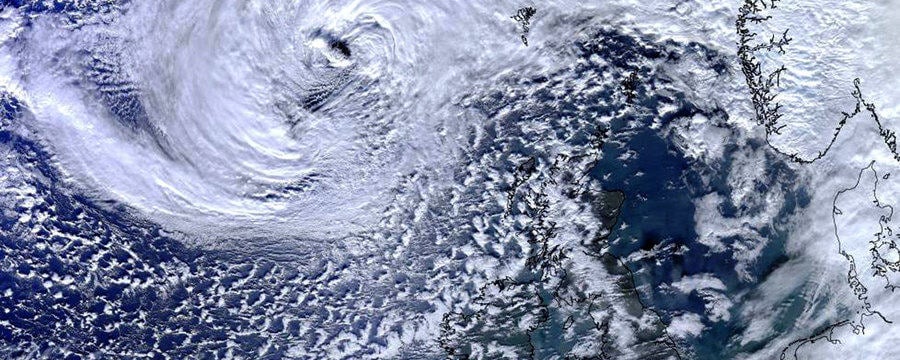
On the 9/10 December 2014, a ‘Weather bomb’ passed over the UK. This is defined as a weather system in which the pressure falls by more than 24 mb in 24 hours. As well as attracting a considerable amount of media attention (probably due to the name), it brought extreme weather (wind and high waves) to the Western and Northern Isles of Scotland (Figure 5).

The naming of the storms

In the winter of 2015/16, a new collaborative venture between the Irish and British Met services was set up to designate names to winter storms that will impact on people in the UK and Ireland. As with North Atlantic hurricanes, the names are alphabetical and alternate between girls’ and boys’ names.
Between November 2015 and March 2016 Abigail, Barney, Clodagh, Desmond, Eva, Frank, Gertrude, Henry, Imogen, Jake and Katie brought varying degrees of disruptive weather. In 2018/ 19, the named storms were Ali, Bronagh, Callum, Deirdre, Erik, Freya, Gareth and Hannah. Freya arrived after a period of record breaking warmth in February bringing snow and strong winds to some.
You can find out more about naming storms at the Met Office’s storm centre.
Depressions and Flooding
A series of depressions can lead to flooding in river basins. The figure below shows the flow of water in the River Thames at Kingston, near London. From top to bottom, each bar alternates between the Winter (October-March) and Summer (April-September) seasons for each year.
The graph in Figure 6 shows the percentage of each season that the flows were in each band, ranging from ‘exceptionally low’ (red), through ‘notably low’, ‘below normal’, ‘normal’ (green), ‘above normal’ (pale blue), ‘notably high’ and ‘exceptionally high’ (black).
In a ‘statistically average’ year: 5% of the bar would be red, 44% would be green, and 5% would be black.
The last 20 years were 4% wetter than 1883-2003 long term average for the Thames catchment. Flows at Kingston reflect this, as you can see from the chart, they were 2-3% more often in the exceptionally and notably high bands (black & blue). Hence flood issues have been more dominant than drought in this period. In particular, right at the bottom of the chart, you can see the winter of 2013/14 when the flow rate in the Thames was exceptionally high for almost 40% of the season.
Figure 6: River flow in the Thames from Winter 1994/95 to winter 2013/ 14 © Chris Beales


© University of Reading and Royal Meteorological Society
This article is from the free online

Come Rain or Shine: Understanding the Weather
Created by
FutureLearn - Learning For Life

Reach your personal and professional goals

Unlock access to hundreds of expert online courses and degrees from top universities and educators to gain accredited qualifications and professional CV-building certificates.

Join over 18 million learners to launch, switch or build upon your career, all at your own pace, across a wide range of topic areas.

Start Learning now