Skip main navigation

New offer! Get 30% off your first 2 months of Unlimited Monthly. Start your subscription for just £29.99 £19.99. New subscribers only. T&Cs apply

Find out more

Sylvia’s solution

End of week tutorial
7.9
I’m Sylvia Knight from the Royal Meteorological Society, and I’m going to look at the air mass case studies that we left you with. So the first one was from November 2010, and you have a weather map here, and we have the pressure contours marked on it. But the first thing we need to do, if we’re going to think about air masses, is to work out which way the air is blowing, which way the wind is blowing along those pressure contours. And to do that, you should be able to consider just about any of the weather systems on this map. But if we look at this low pressure system here first, the wind’s blowing around it in an anticlockwise direction.
43
And that tells you that the air is moving along these pressure contours like this. On the other hand, if we thought about this high pressure here, the air’s moving around there in a clockwise direction. So that again, tells you that the air’s moving along those pressure contours in the same direction. Or again, thinking about these lows, that’s going around in an anti-clockwise direction, so that’s again, putting a direction of motion on these pressure contours in this direction. So the air is basically moving from around here, along those contours, and up there on this day. So if we consider the United Kingdom, the air’s coming at us along these precious contours from up here.
84.1
So it’s polar continental air that’s affecting us. But it’s polar continental air that’s crossed a pretty cold Scandinavia in November, and then hit the North Sea, and taken quite a long path across the North Sea. So it’s had plenty of time to pick up moisture. So on this particular occasion in November 2010, this very moist, very cold air hit the east coast of the UK, and we got a huge amount of precipitation, but it didn’t fall as rain, it fell as snow. So vast quantities of snow falling, unprecedented, well not unprecedented but really quite high volumes of snow falling on the east coast of the UK. And I’m sure you could look up some news reports from that event.
128
So it was November, the sun isn’t having too much of an impact in November, so you wouldn’t expect there to be too much of a difference between day and night. On the other hand, it’s very much the east coast that’s being the first place that this moist, cold air is hitting. So it’s going to be the east coast that was experiencing most of the bad weather. There wasn’t anywhere near as much snow over on the western side of the British Isles.
155.2
If we look at the next case study from the end of September, beginning of October 2011– this time, If we look at this high pressure weather system to work out which way the air is coming at the UK, it’s travelling around that in a clockwise direction. So it’s coming up these pressure contours from the South. So it’s very much tropical air that was reaching us. It had mainly travelled– if you follow this contour back, it’s coming over Spain, across the Mediterranean, and down into Africa. So it’s tropical continental air, very dry, very warm. And it gave us very nice weather. In fact, I think there was a record breaking October day at beginning of October 2011.
196.2
The temperatures were the highest ever recorded in October. So that brought us really nice dry, warm weather.
206.5
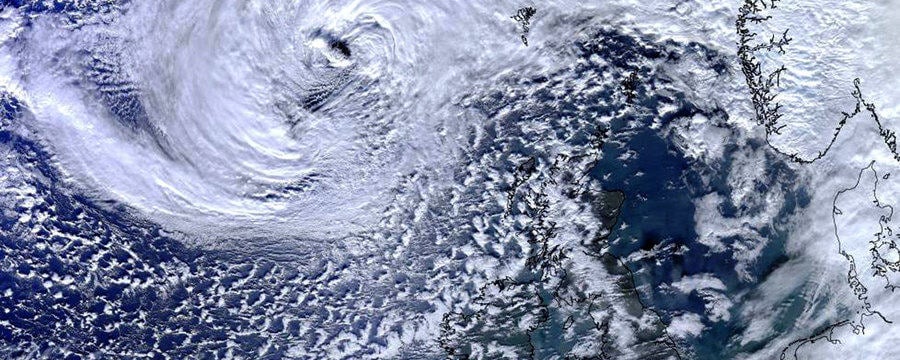
On the other hand, if we look at the end of January, beginning of February 2015, and if we consider these low pressure systems here as going around there in an anti-clockwise direction, that tells us the direction of motion on these pressure contours is down from the North, straight down from the North at the United Kingdom. So this was arctic maritime air, the coldest air that we can get. Very cold air coming down here. Lots of moisture picking up over the ocean, before it reaches us. So a considerable amount of snowfall again. It will be the first bit of land that it reaches that will get most of the snow, so the north of Scotland.
245.8
But then, there will be isolated places over the United Kingdom, as the air travel south, where convection will occur again. Maybe that’s because there’s a bit of higher ground and the air’s forced to rise. Maybe because there’s a little patch of ground that’s a little bit warmer than the ground around it, and so that triggers off some convection. But anyway, this gave very patchy snow showers, very difficult to forecast snow showers into the United Kingdom, with little, very isolated snow showers. So one place might be experiencing a heavy snow shower, where somewhere else, just a few tens of kilometres away wasn’t experiencing any snow at all. So again that was a memorable weather event for the United Kingdom.
284.4
And maybe now when you see with a weather map, maybe on the news on the television or just on a website, you can start thinking about where the air’s coming from and what that means for the kind of weather that the UK will be experiencing.

How did you get on?

In this video, Sylvia demonstrates the solution to the air mass exercise in the previous Step.

You may have noticed the ‘geostrophic wind scale’ in the top left of these and other weather maps. You may remember that the closer the pressure contours are to each other, the faster the wind blows. This scale allows you to calculate the wind speed from the pressure contour separation.

Close up of wind scale

To find the wind speed at a given place, first of all, see what latitude you are at – the curved lines of latitude are labelled, at 10° intervals. Then, measure the shortest distance between the contours at that place. In the example shown below, at 60° North, the distance is shown in red.
Now, measure the same distance from the left hand side of the scale, at the appropriate latitude. Again, we’ve shown it in red in the example below. You can then use the curved lines to read the wind speed – in our example, the same length red line takes you to somewhere between the 15 and 25 knot lines, so the wind speed at the marked place is about 20 knots (1kt =0.5 m/s or metres per second, or 1.2mph or miles per hour).

The actual wind speed at the ground will always be less than the geostrophic wind speed because of friction. Friction will slow the wind more over land than over water. Rules of thumb suggest that the wind will be 2/3 of the geostrophic speed over water and 1/3 over land, but it will vary considerably.

This article is from the free online

Come Rain or Shine: Understanding the Weather
Created by
FutureLearn - Learning For Life

Reach your personal and professional goals

Unlock access to hundreds of expert online courses and degrees from top universities and educators to gain accredited qualifications and professional CV-building certificates.

Join over 18 million learners to launch, switch or build upon your career, all at your own pace, across a wide range of topic areas.

Start Learning now