Skip main navigation

Will it snow?

xx
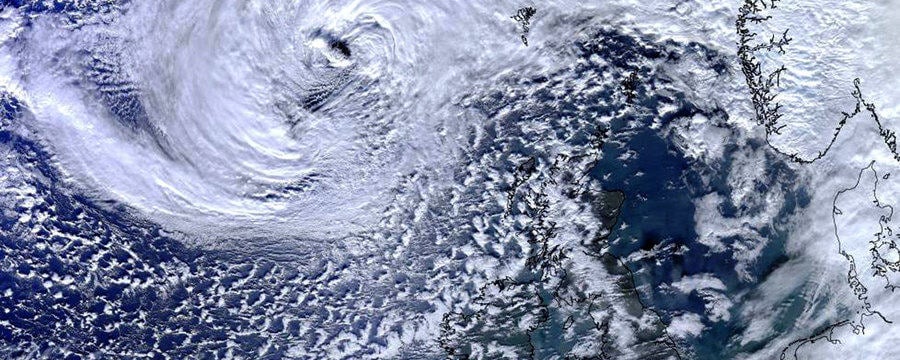
Satellite image taken on Christmas Eve 2010 - the most recent White Christmas in the UK.
© NEODAAS/University of Dundee

In this activity, you’ll be looking at the factors which determine whether a mid-latitude country gets snow. By looking at various charts, you’ll be able to see whether anywhere in Europe is currently likely to experience snow or not. It’ll be much more likely at some times of the year than others!

Test your skills using current weather charts

To have snow, we need a combination of two factors:

  • A weather front, convection or orography needs to be causing precipitation.
  • The atmosphere needs to be cold enough for that precipitation to fall as snow.

Hopefully, through what you’ve already learnt in the course so far, you’ll be able to predict when we’re likely to get precipitation. Let’s put your skills into practice.

First, follow this link to the Met Office website to look at a current surface pressure chart. Can you see any fronts? Is the air mass going to bring precipitation? Don’t forget, Arctic maritime or Polar continental air masses can bring snow in winter to the UK.

Having established whether the UK is likely to have precipitation, you now need to see whether the atmosphere is cold enough for that precipitation to fall as snow.

First, follow this link on Net Weather TV to look at some weather forecast charts on netweather.tv (in the charts and data menu). Select ‘HGT 500-1000’ from the ‘select chart type’ menu. A general rule is that, if the 528dam line is south of where you are and there is a forecast of precipitation, then that precipitation is likely to be snow.

What is the 528dam line?

528dam = 5280m

This line is the vertical distance between the level where the air pressure is 1000mb (somewhere near the ground) and level where it is 500mb (somewhere in the middle of the troposphere). In other words, the thickness of the bottom half (by mass) of the atmosphere. As warm air is less dense than cold air, the smaller this distance, the colder the air is.

Let’s look at an example. In Figure 2 you can see a weather chart for Europe from the 8 December 2017. Anywhere with values below 528dam (blues and purples) is cold enough for snow. In Figure 2, most of the UK, Belgium and the Netherlands is polewards of the 528 line and would therefore get snow. The thin black lines show the pressure contours – there is a Low over Scandinavia, giving northerlies over the UK – Arctic maritime air. This produced snow showers, and subsequent heavy snowfall over much of central England and Wales when an occluded front moved over on the 10 December.

Figure 2: A weather chart for Europe which shows the thickness of the bottom half of the atmosphere. Anywhere with values below 528dam (blues and purples) is cold enough for snow ©netweather.tv

The Met Office actually marks the thickness lines on its forecast charts – if you go back to the Met Office website and look at least a day and a half ahead, you should see the lines marked on the charts with dashed red labelled lines. The 528, 546, 564 and 582 dam lines are shown.

So what’s your forecast? Does anywhere in Europe look like it might get snow at the moment? Share your thoughts in the discussion area below.

If you’d like to explore this topic further you can also try the following additional material.

You might have heard the phrase ‘it’s too cold for snow’. This can be true in large continental areas such as North America, Siberia, Antarctica etc. where extremely low air temperatures lead to very low evaporation rates from lakes and rivers, and consequently very dry air. Even when cloud forms, the ice crystals rarely get big enough to fall as precipitation. In the UK, an island surrounded by relatively warm water, the air is always relatively moist and so it’s extremely unlikely to be too cold for snow.

It’s useful to check whether the atmosphere really is cold enough throughout its entire depth for precipitation to fall as snow. If there’s a warmer layer (above freezing) just above the ground, the snow will melt. Go to the German website Wetter 3, to look at current temperatures throughout the atmosphere. Select the ‘Vertikalschnitte’ thumbnail (vertikalschnitte means vertical section in English). This option will take you to a web page with two interlinked charts. We’ve included a screen shot of this page in Figure 3 as an example. Move the pointer on the right hand side of the left hand map to change the latitude of the cross section, and see how the longitude/ height section on the right changes. Whereabouts on the map is the atmosphere coldest, and how does the temperature change with height? Does anywhere in Europe have temperatures below freezing throughout the whole depth of the atmosphere?

Figure 3: The Wetter3 gives you a horizontal weather map (left) with a moveable red pointer (centre) which allows you to select the latitude of the longitude/ height cross section through the atmosphere shown on the right. This lets you see how the temperature of the atmosphere falls with height. © wetter.de.

Will it be a white Christmas?

“I’m dreaming of a white Christmas” sang Bing Crosby – but what are the chances of getting snow on Christmas Day?

Now that you are able to predict the likelihood of snow, you can bookmark the links we have provided and return to them closer to 25 December to see if it is due to snow on Christmas day! In the meantime, you may be interested in this recent map by Haayoaie on the probability of snow at Christmas across Europe.

Figure 4: The probability of snow at Christmas across Europe. ©Map created by Haayoaie/Reddit
© University of Reading and Royal Meteorological Society
This article is from the free online

Come Rain or Shine: Understanding the Weather
Created by
FutureLearn - Learning For Life

Reach your personal and professional goals

Unlock access to hundreds of expert online courses and degrees from top universities and educators to gain accredited qualifications and professional CV-building certificates.

Join over 18 million learners to launch, switch or build upon your career, all at your own pace, across a wide range of topic areas.

Start Learning now