Some example country timelines
In this mini-lecture, Dr Angus Campbell presents the COVID-19 case timelines for 13 different countries using the graphing tools from OurWorldInData.
We see that there is no one way to report and interpret data, and that taking a variety of views helps deepen our understanding. Looking at absolute case numbers helps us understand the total magnitude of the outbreak. However, this needs to be put into the perspective of the size of the jurisdiction represented by the data: a ‘big’ number of cases might be less concerning in a ‘big’ country – providing it has the resources to deal with it. Similarly, looking at how the outbreak varies over time is vital for understanding whether the disease is being managed adequately throughout the emergence, response and ongoing management phases of the outbreak. We use a series of example countries here but there are links to the data resources below, where you can view data from other countries in the different formats we present.
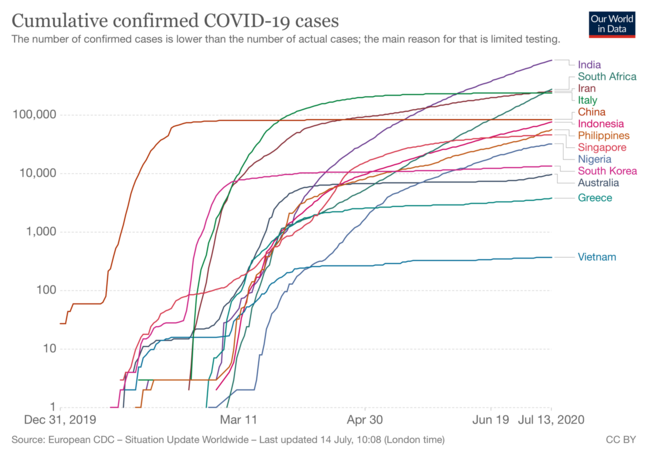 Total cumulative confirmed COVID-19 cases for selected countries, January to June 2020 (Source: OurWorldInData.org)
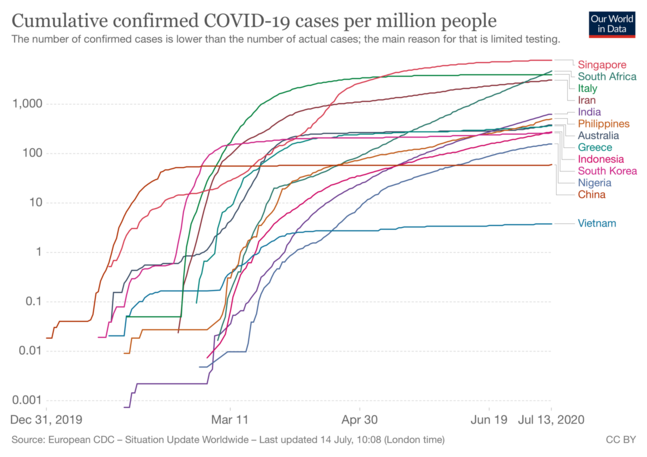 Total cumulative confirmed COVID-19 cases for selected countries, January to June 2020 (Source: OurWorldInData.org)