Skip main navigation

Green Performance Map

This article investigates the Green Performance Map (GPM).
© Luleå University of Technology
The green performance map method (GPM) is based on Lean Production principles. The aim is to visualise environmental aspects of a system and create a GPM-map. The idea behind the method is to enable a systematic approach for analysing and prioritising environmental aspects. The purpose is to identify and enable concrete sustainability improvements.

Environmental awareness

A company that works with production systems can be rated on four levels showing their degree of “environmental awareness”:

1. Laws and rules (follows laws in place such as certifications)

2. Environmental expertise (has experts that drive an environmentally focused approach)

3. Consciousness (widespread understanding of the environmental effects of the system)

4. Engagement (broad engagement with regards to environmental improvement; everyone contributes and understands how they can participate).

When developing production systems it is key to strive for the highest possible level. But this might take time, depending on the maturity of the organisation and surrounding factors.

The GPM method

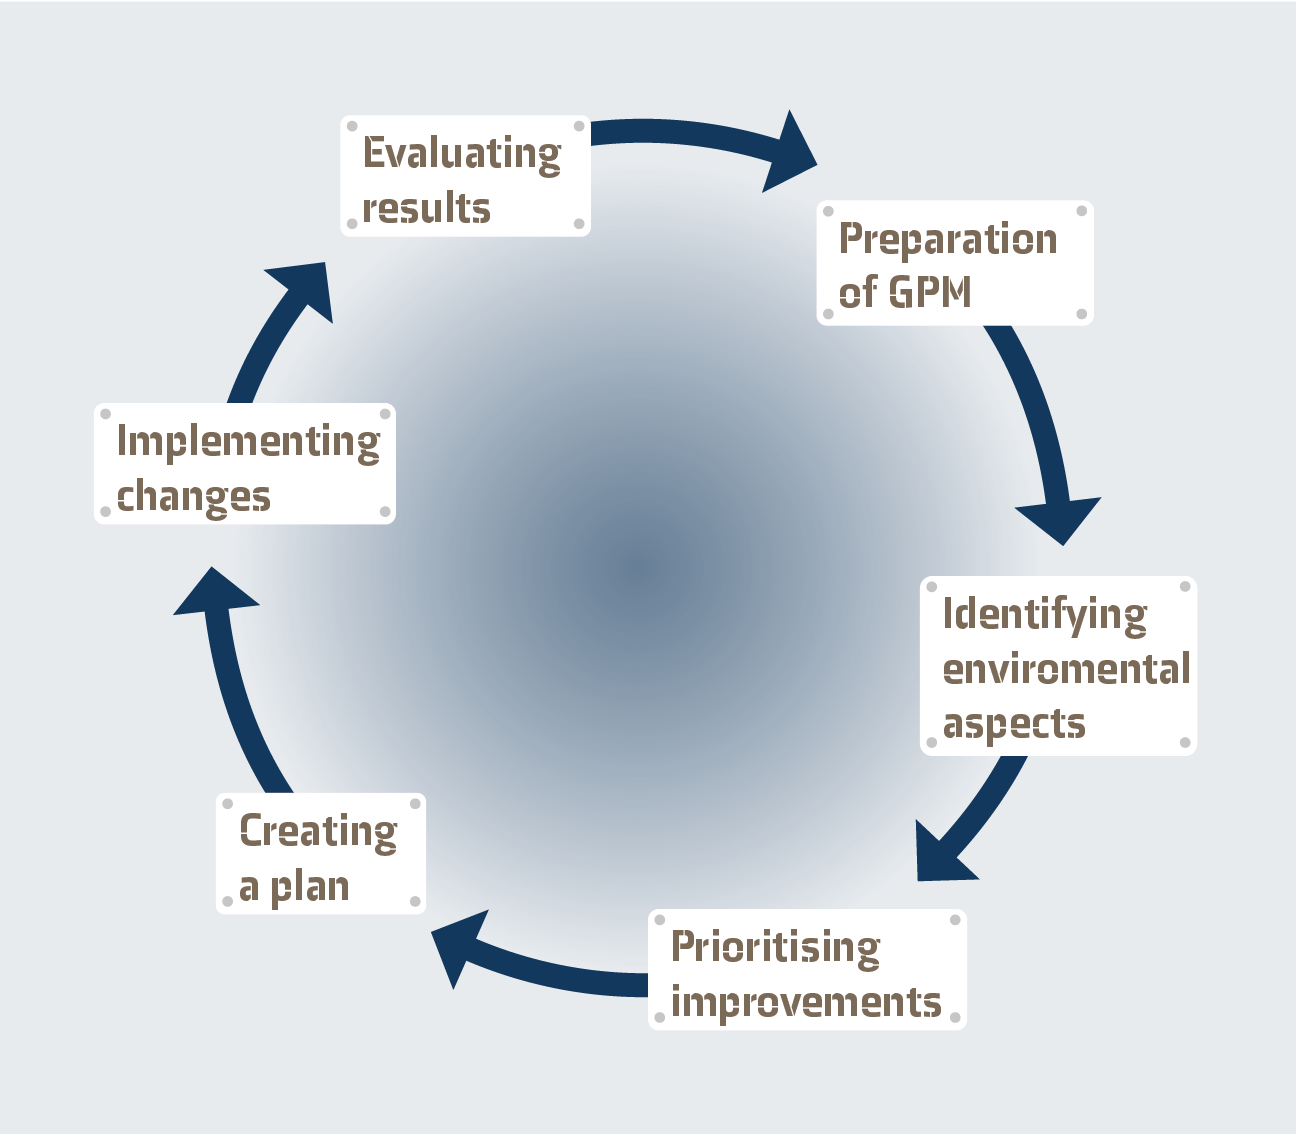
The GPM method is made up of different activity steps, as this figure shows:

A circle with arrows pointing towards each activity step in the GPM method

GPM is a bottom up approach applied as a part of the continues improvements work within the different teams in the organisation focused on the processes and operations that they work with and controls. The environmental aspects are visualised in categories of both input and output (see figure below) to map and prioritize the different environmental aspect at the different activities/steps outlined in the figure above.

GPM catagory visualisation

Input categories include:

  • Energy
  • Water
  • Core material
  • Additional material

Output categories include:

  • Productive output
  • Leftovers
  • Air/noise emissions
  • Water/ground emission

The GPM map illustrates the chosen system and the input and output that are present in it. It is similar to mapping a process, but the environment is in focus. Further evaluation is then done to classify the impact of each input and output.

The result is then a better idea of which aspects have the largest negative environmental impact and possible measures to be taken.

This article is partly based on the Vinnova FFI (Vehicle strategic research and innovation) report 2009-00975, “Gröna produktionssystem” (Bellgran et.al., 2009).

© Luleå University of Technology
This article is from the free online

Exploring Sustainable Production Systems

Created by
FutureLearn - Learning For Life

Reach your personal and professional goals

Unlock access to hundreds of expert online courses and degrees from top universities and educators to gain accredited qualifications and professional CV-building certificates.

Join over 18 million learners to launch, switch or build upon your career, all at your own pace, across a wide range of topic areas.

Start Learning now