Skip main navigation

Magnitude and risk to human life

Read about and explore the relationship between the magnitude of a natural hazard and the number of fatalities associated with that hazard.

One of the major risks of extreme events is the loss of human lives or fatalities.

When looking at events in Sumatra and Alaska in the previous step we saw a disparity in the number of fatalities. This was despite the events being of a similar magnitude. One of the factors for this was the greater population density in Sumatra compared with Alaska.

When looking at these events, a simple hypothesis might be:

the larger the magnitude of the natural hazard, the larger the amount of fatalities associated with that hazard.

We can evaluate this hypothesis by looking at the number of fatalities related to earthquakes and volcanic eruptions.

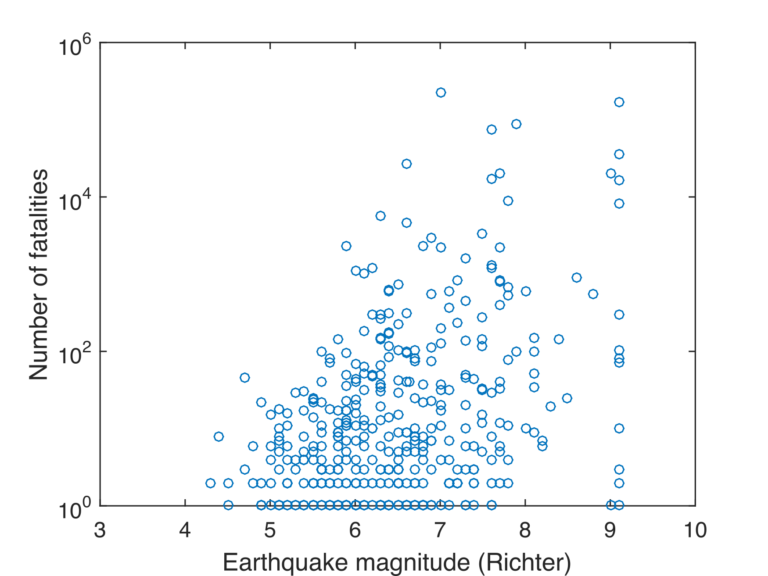
This figure shows all recorded fatalities for earthquakes against the magnitude of the earthquake. The data is taken from the EM-DAT database.

Does this data prove or contradict our hypothesis?

A scatter graph with data on all earthquakes between 9 January 1997 and 25 November 2018 that had at least 1 fatality. The vertical axis lists the number of fatalities using a logarithmic scale (100=one, 102=one hundred, 104=ten thousand, 106= one million). The horizontal axis lists earthquake magnitude using the Richter scale and ranging from 3 to 10. The scatter graphs shows that the number of fatalities can vary anywhere between zero and a maximum number for a given earthquake magnitude.

Note that the database uses the Richter scale to indicate the earthquake magnitude rather than the more common Moment magnitude, but it can be used for the same purpose here.

The number of fatalities is shown in a logarithmic scale (100=one, 102=one hundred, 104=ten thousand, 106= one million). The figure shows data for all earthquakes between 9 January 1997 and 25 November 2018 that had at least 1 fatality.

Let’s also plot some earthquakes on the figure that we’ve spoke about in the course.

Our conclusions

We can make the following observations from this figure:

  1. Our simple hypothesis of large earthquakes leading to more fatalities is not true. The number of fatalities can vary anywhere between zero and a maximum number for a given earthquake magnitude.

  2. The maximum number of fatalities increases with earthquake magnitude, but at magnitude 7 (Richter), it appears to level off to around several hundreds of thousands.

  3. What we consider regular earthquakes can lead to similar numbers of fatalities as megaquakes.

  4. Megaquakes are infrequent, but do occur regularly throughout recorded history.

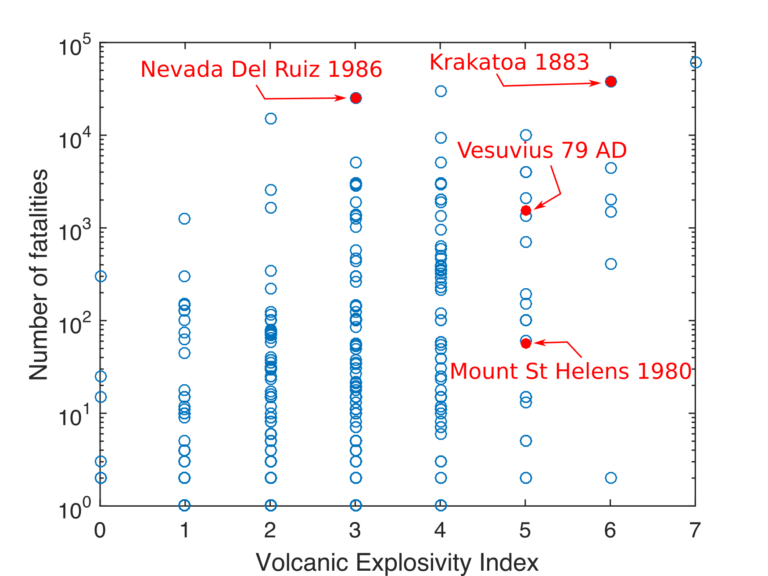
Similarly, we can explore our hypothesis for volcanic eruptions using the following figure.

Does this data prove or contradict our hypothesis?

A scatter graph with data on all known fatalities of volcanic eruptions between 1510 AD and 2017. The vertical axis lists the number of fatalities using a logarithmic scale (100=one, 101=ten, 102= one hundred, 103= one thousand, 104=ten thousand, 105= one hundred thousand). The horizontal axis lists the Volcanic Explosivity Index ranging from 0 to 7. This graph has the following eruptions labelled on it; 1986 Nevada Del Ruiz, 1883 Krakatoa, 79AD Vesuvius, 1980 Mount St Helens. The scatter graph shows that the number of fatalities can vary anywhere between zero and a maximum number for a given Volcanic Explosivity Index.

This figure contains all known fatalities of volcanic eruptions between 1510 AD and 2017. The number of fatalities is shown in a logarithmic scale (100=one, 101=ten, 102= one hundred, 103= one thousand, 104=ten thousand, 105= one hundred thousand).

The data comes from the Volcanic Fatalities Database provided in the study of Brown et al. 2017.

Four eruptions that we have encountered during this course are highlighted on the figure. But the 2010 Eyjafjallajökull eruption had no known fatalities and the 1986 Lake Nyos disaster occurred without an eruption so are not included.

Our conclusions

We can make the following observations from this figure:

  1. Our simple hypothesis of large eruptions leading to more fatalities is not true. The number of fatalities can vary anywhere between zero and a maximum number for a given Volcanic Explosivity Index. This is quite similar to the data for earthquakes.

  2. The maximum number of fatalities increases with VEI.

  3. We have only one data point for a VEI 7 eruption and none at all for supereruptions. This is because the frequency of these eruptions is very low. The last supereruption occurred 25600 years ago in New Zealand (known as the Oruanui eruption) much before recorded history. Equally it might not happen again for tens of thousands of years.

As we’ve seen the relationship between magnitude and risk to life isn’t straightforward. In the upcoming activity we’ll explore how we consider those relationships when preparing for future events.

© Cardiff University
This article is from the free online

Extreme Geological Events

Created by
FutureLearn - Learning For Life

Reach your personal and professional goals

Unlock access to hundreds of expert online courses and degrees from top universities and educators to gain accredited qualifications and professional CV-building certificates.

Join over 18 million learners to launch, switch or build upon your career, all at your own pace, across a wide range of topic areas.

Start Learning now